Hi all, we’ve got a dev setup for testing with the following:
1x RAK 7244 Gateway
1x Sentrius RG1xx Gateway
1x RAK Button
1x RAK Modbus Gateway (node)
1x Pycom FiPy
Have been getting pretty good results (about 1 kilometer radius range) with both gateways indoors in a medium density residential area here in the US.
We’re LOVING the things stack OSE, which we’re running on a single VM in GCP.
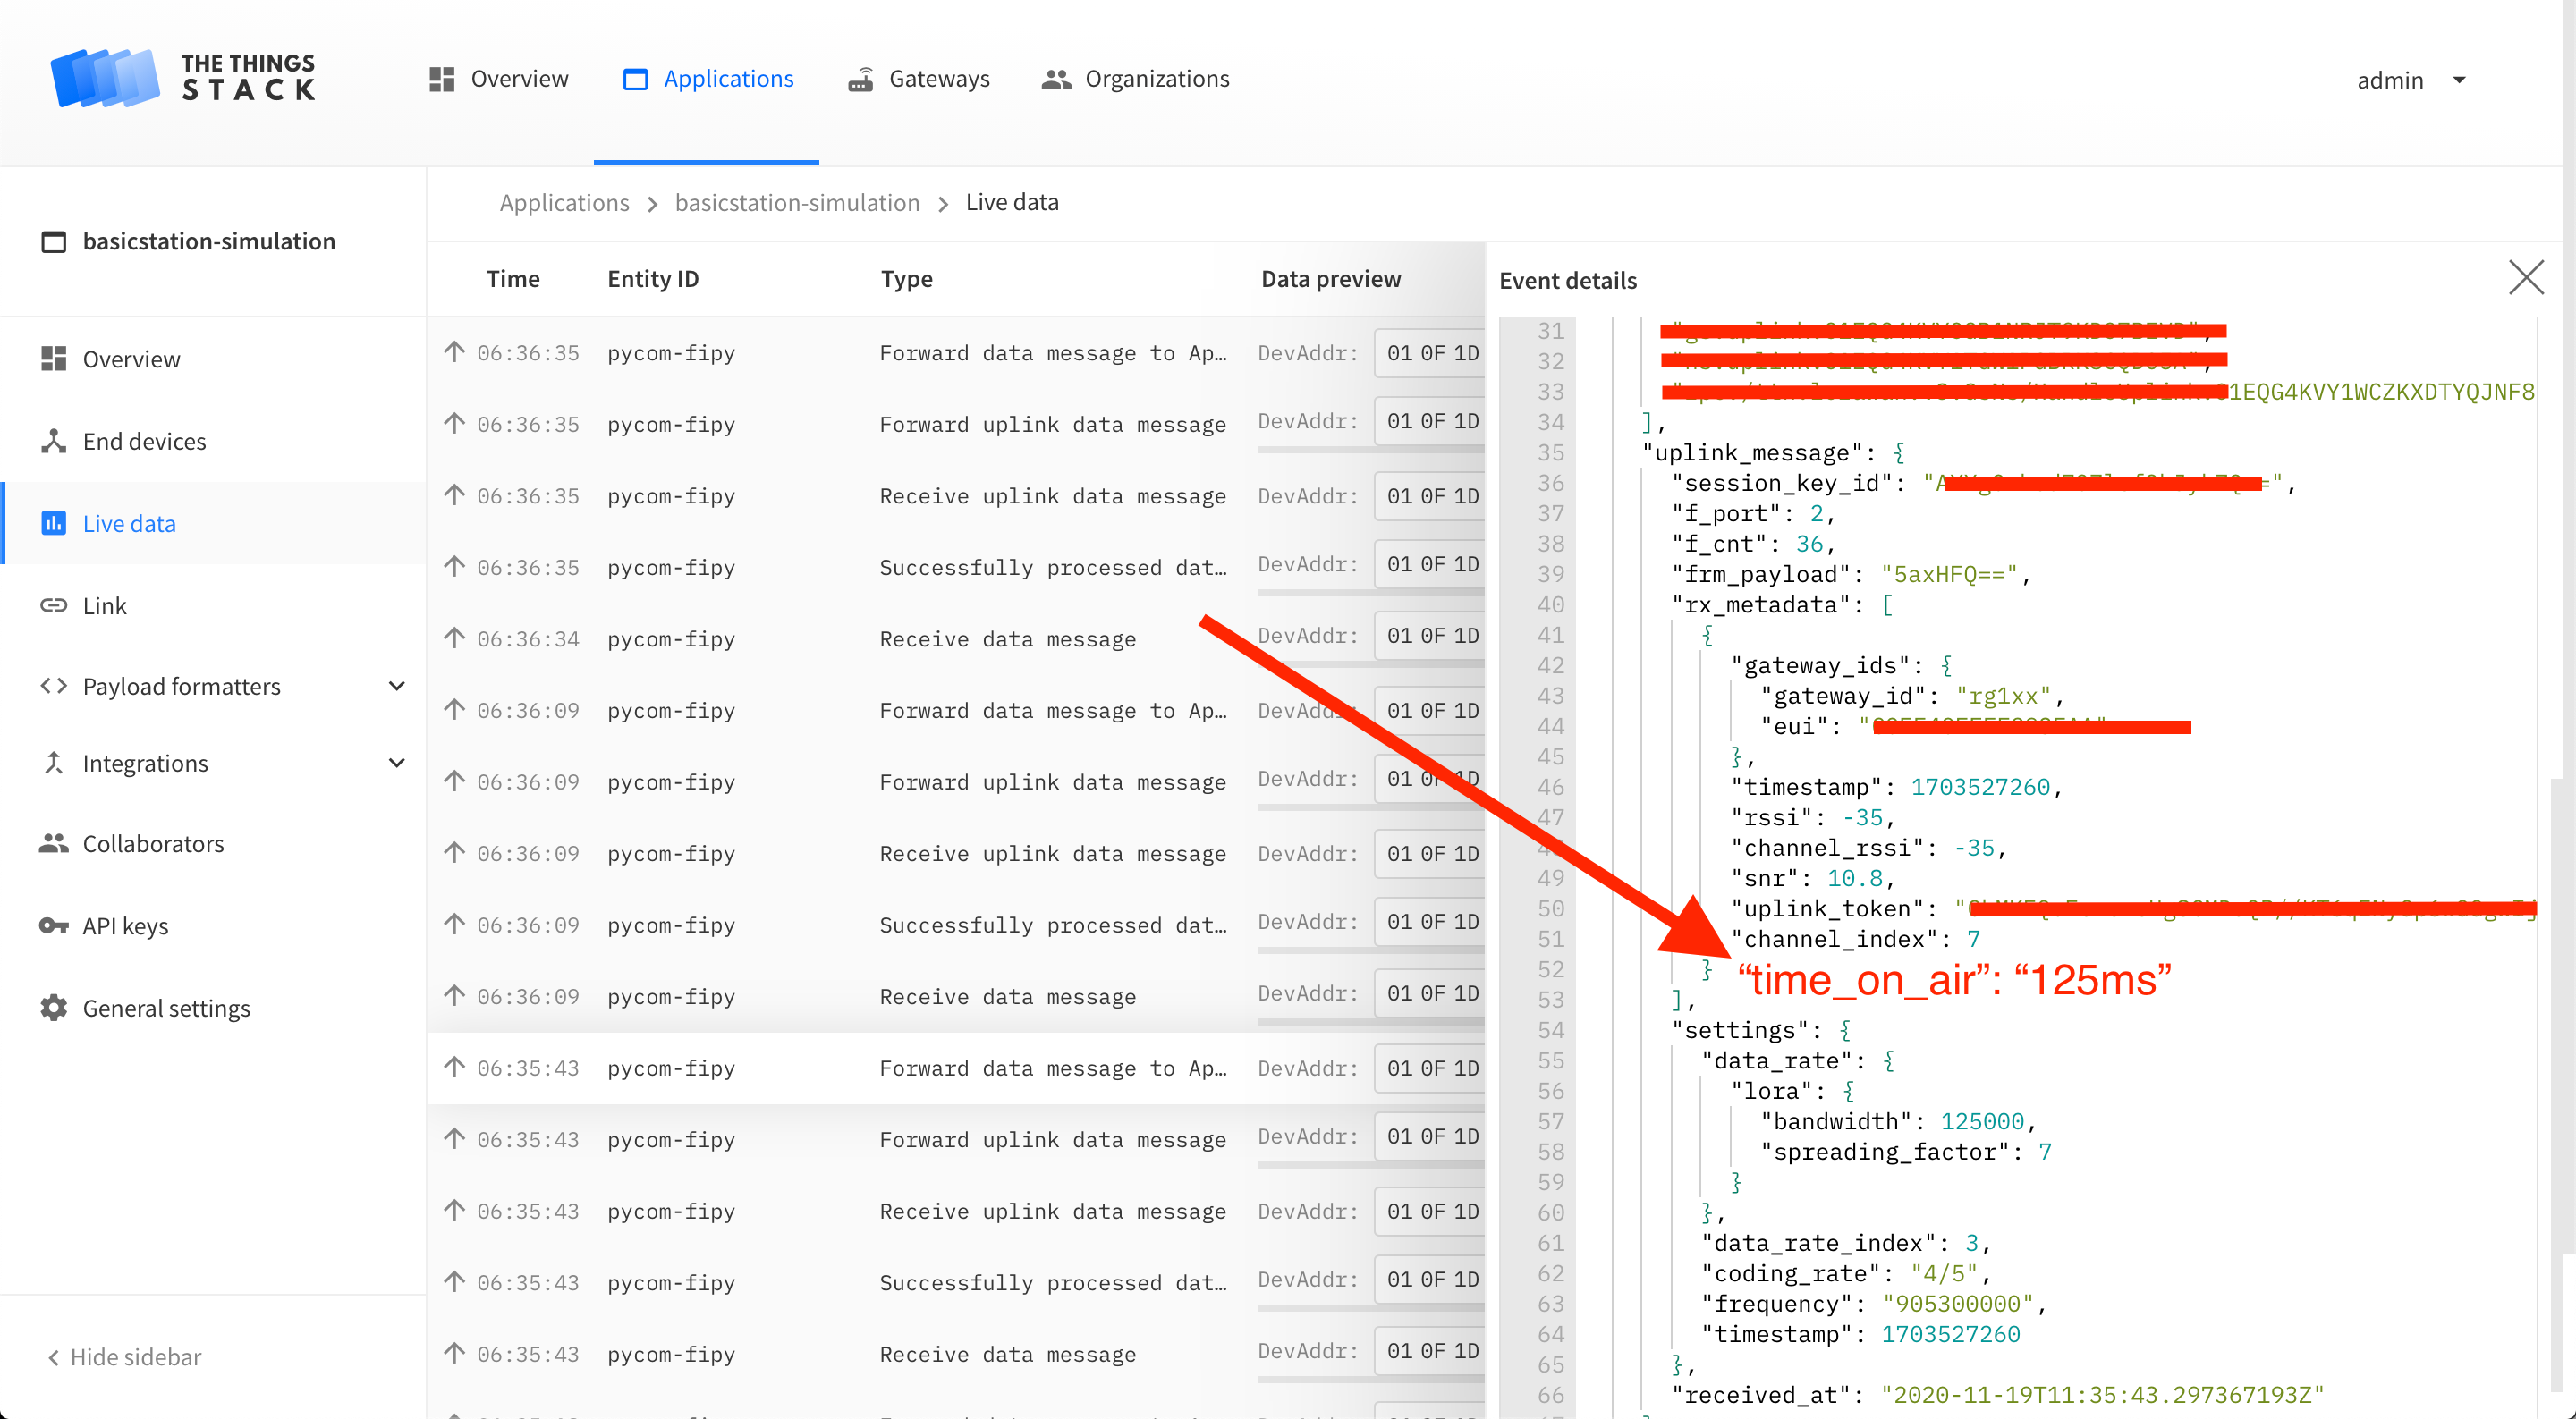
However, I cannot find the time-on-air metrics for messages anywhere in the console or logs. Any suggestions??
I’d like to expose the TOA metrics to a dashboard so we can keep an eye on our duty cycle. Ideally, we’d get per message TOA figures which we can then aggregate and use to optimize certain nodes.
There are several implementations floating around: you need the total (raw) packet length, spreading factor, bandwidth and the fact that it is 4/5 coding
I suspect it already is calculated for internal purposes (at least in some regions, it would be needed); if you are willing to modify the code you could expose it.
But procedurally it may be simpler to calculate yourself at the point of need.