TimeStamp Issue - Join Request and Accept Work - Packet Rejected Timestamp Wrong

Hello,

This is my first post on the TTN forum. I am not a LoRa or TTN expert.

I have searched the forum and found two similar posts here and here. The posts are interesting but neither offer a clear solution I can implement.

Kerlink Support have asked me to get in touch as they believe the problem I am experiencing is with TTN. The node is a Tek766 ultrasonic sensor currently installed on a Water Tank in Rwanda. We have installed many of these devices and they work extremely well. This device in particular was installed a month ago and has worked flawlessly until we recently rebooted the Kerlink Gateway several days ago.

Basically, since the gateway reboot the node keeps giving this message error message every 30 minutes…

Jan 24 11:39:10 Wirnet local1.err lorad[858]: <3> Packet REJECTED, timestamp seems wrong, too much in advance (current=2017916992, packet=2016521172, type=0)

When I convert these timestamps they seem to be in 2033 so something is obviously wrong.

Here is an extract from the Lora.log file showing the JOIN request and JOIN accept.

> Jan 24 11:39:02 Wirnet local1.info lorad[858]: <6> Sent 1 uplink message
> Jan 24 11:39:02 Wirnet local1.info lorafwd[1790]: <6> Received uplink message: 
> Jan 24 11:39:02 Wirnet local1.info lorafwd[1790]: <6> | lora uplink (40100049), payload 23 B, channel 868.1 MHz, crc ok, bw 125 kHz, sf 12, cr 4/5
> Jan 24 11:39:02 Wirnet local1.info lorafwd[1790]: <6> | Join Request, JoinEUI 244E7BF000002180, DevEUI 244E7B000000231B, DevNonce 58159
> Jan 24 11:39:02 Wirnet local1.info lorafwd[1790]: <6> |  - radio (00000105)
> Jan 24 11:39:02 Wirnet local1.info lorafwd[1790]: <6> |   - demodulator counter 2010521172, UTC time 2020-01-24T11:39:02.897931Z, rssi -72.1 dB, snr 7.75< 10 <13.5 dB
> Jan 24 11:39:03 Wirnet local1.info lorafwd[1790]: <6> Uplink message (4105) sent
> Jan 24 11:39:05 Wirnet local1.info lorafwd[1790]: <6> Uplink message (4105) acknowledged in 2102.25 ms
> Jan 24 11:39:07 Wirnet local1.info lorafwd[1790]: <6> Heartbeat (4128) sent
> Jan 24 11:39:08 Wirnet local1.info lorafwd[1790]: <6> Heartbeat (4128) acknowledged in 593.667 ms
> Jan 24 11:39:08 Wirnet local1.info lorafwd[1790]: <6> Uplink message (4106) sent
> Jan 24 11:39:09 Wirnet local1.info lorafwd[1790]: <6> Uplink message (4106) acknowledged in 951.214 ms
> Jan 24 11:39:10 Wirnet local1.info lorafwd[1790]: <6> Downlink message (2C3E) received
> Jan 24 11:39:10 Wirnet local1.info lorafwd[1790]: <6> Received downlink message: 
> Jan 24 11:39:10 Wirnet local1.info lorafwd[1790]: <6> | lora downlink (00002C3E), payload 33 B, required 1, preamble 8 B, header enabled, crc disabled, polarity inverted
> Jan 24 11:39:10 Wirnet local1.info lorafwd[1790]: <6> | Join Accept
> Jan 24 11:39:10 Wirnet local1.info lorafwd[1790]: <6> |  - radio (00000000), channel 869.525 MHz, bw 125 kHz, sf 12, cr 4/5, power 27 dB
> Jan 24 11:39:10 Wirnet local1.info lorafwd[1790]: <6> |   - transmission (00000000), priority 1, on counter 2016521172
> Jan 24 11:39:10 Wirnet local1.info lorad[858]: <6> Received downlink message
> Jan 24 11:39:10 Wirnet local1.err lorad[858]: <3> Packet REJECTED, timestamp seems wrong, too much in advance (current=2017916992, packet=2016521172, type=0)
> Jan 24 11:39:10 Wirnet local1.err lorad[858]: <3> Failed to enqueue downlink message
> Jan 24 11:39:10 Wirnet local1.info lorafwd[1790]: <6> Received uplink message: transmission event (00002C3E / 00000000), status "Bad timing"
> Jan 24 11:39:10 Wirnet local1.info lorafwd[1790]: <6> Downlink message (2C3E) acknowledged
> Jan 24 11:39:17 Wirnet local1.info lorafwd[1790]: <6> Heartbeat (4129) sent
> Jan 24 11:39:18 Wirnet local1.info lorafwd[1790]: <6> Heartbeat (4129) acknowledged in 650.129 ms

Here is the message from Kerlink asking me to ask TTN for support…

The error message “Packet REJECTED, timestamp seems wrong, too much in advance”, means the message was sent to late by the LNS (from TTN), so the gateway drop the message because, physicaly , it’s not possible to reach the open frame window of the end-device.

On the Kerlink WMC LNS (lora network server), we have a parameter to balance this delay in the backhaul network (between the server and dthe gateway), so the gateway receive the message earlier from the LNS server, and have the time to treat and send it in time.

Please ask to TTN support to know how to use the same feature.

One solution I have tried in order to attempt to solve the problem is to deleted the device, deleted the application, and rename both the device and application with brand new names. However, I seem to end up with the same problem. The JOIN request and JOIN accept work. The device is even visible in TTN Console as green an active ‘several minutes ago’. However the packet timestamps are wrong, the packets are dumped and no data reaches the application.

If anyone can help us understand why there is a problem with these TIMESTAMPS it would be highly appreciated.

Regards
The packet timestamps do not impact forwarding of data to the application.
Do you have the application data window open while the sensor is sending data? Did you check if data is visible in the data tab of the application? (You need to keep it open for data to show)

The packet timestamp issue is for data towards the node. What kind of connectivity are you using between the kerlink and TTN? Is it wired internet or 3g/4G? Which TTN region is the gateway connected to? What are typical network latencies? Keep in mind the data from the gateway needs to get to TTN, be processed and an answer needs to be back at the gateway within 1 second. That means you need a fast internet connection for the packet to arrive on your gateway with a timestamp that is still in the future.

They are not. These are not Unix timestamps in seconds, the unit used is microseconds.

1 Like

Not only are the timestamps in microseconds, they are meaningless outside of the gateway itself. The gateway just has a free-running 32 bit counter that is used so that downlinks can be programmed to send exactly 1, 2, (or for joins 5 or 6) seconds after the end of the corresponding uplink. If two gateways receive a packet, they’ll record entirely unrelated timestamps for it - the number is only useful to tell the same gateway to do something at a time relative to what it previously marked.

And that counter rolls over in a bit over an hour - which is why a request from the servers arriving at the gateway a bit over a second too late, gets recorded as too early - the next time the counter reaches the desired value would be over an hour into the future.

2 Likes

Dear Jac, thanks for the reply to my forum post - your support is highly appreciated!

To quickly answer your question…

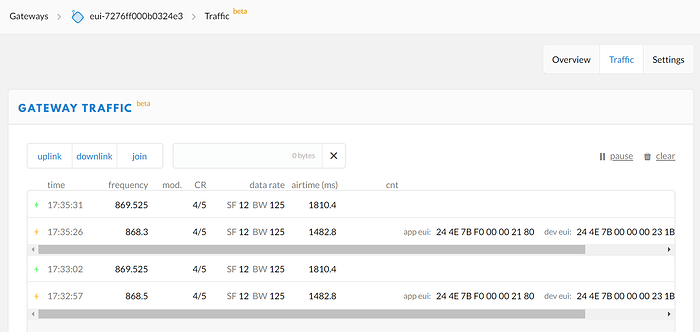
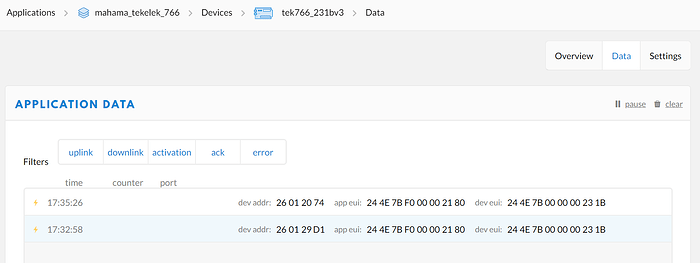
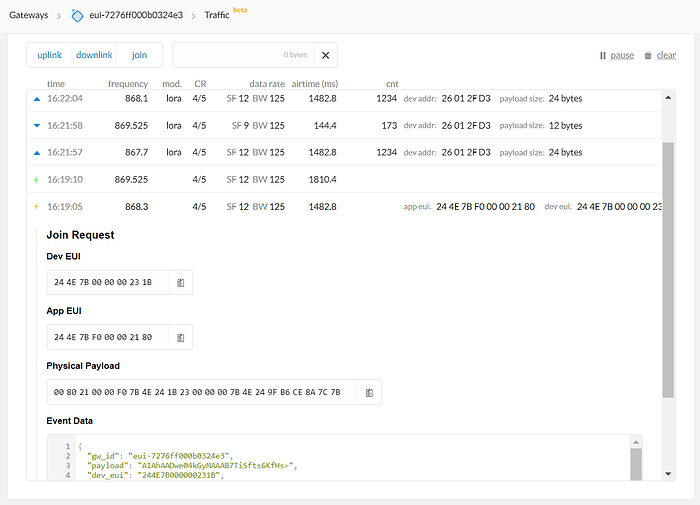
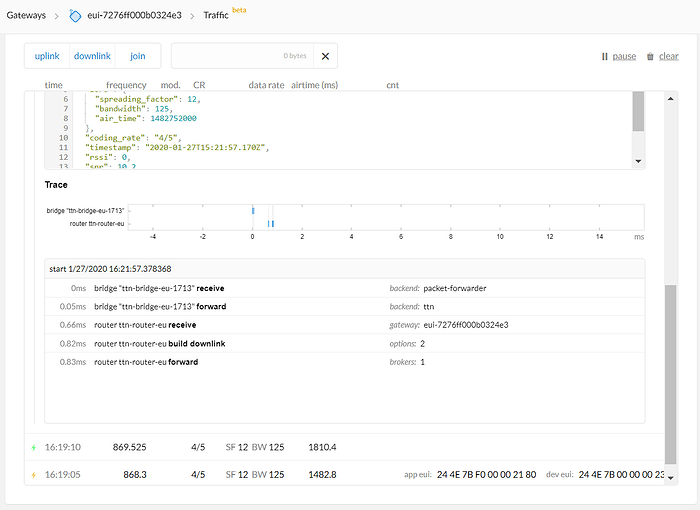
Yes, this is what it looks like on the Gateway Traffic side and Application Data side.

As you can see on the Gateway we get a JOIN Request and JOIN Accept.

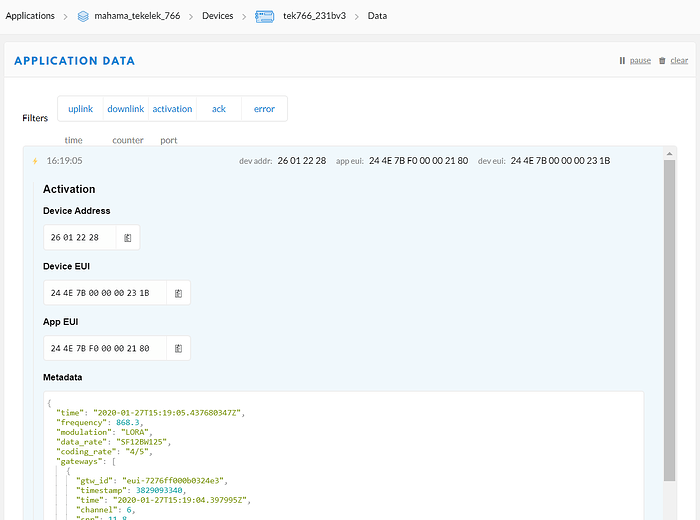
However on the Application we only have the orange JOIN Requests. Any idea why we don’t see the JOIN Accept?

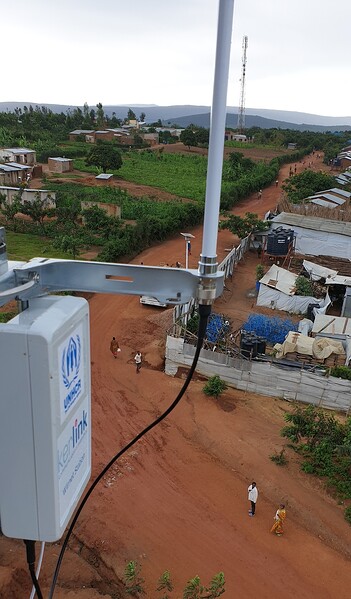
We are running the Kerlink Gateway via a Solar Panel and 3G Backhaul.

The gateway is connected to TTN EU ( ttn - router - eu) . I have not checked the network latencies (i’m not quite sure how to do that but could easily Google it). However I don’t think the problem is network latency as we have other nodes on the network that are performing fine over the same Gateway (e.g. a NAS Pulse Reader attached to the water network flow meter). This node has also performed fine for the last month. The problem started recently when we rebooted the Gateway.

Thanks, I’m showing my total lack of knowledge about IOT architecture :wink: so this value is just used locally.

Once again - I hope these answers help to understand where the problems are and what can be done to get back up and running again. Thanks in advance for the support.

Actually, when hovering that orange icon, you’ll see it’s an “Activation”. It also shows the DevAddr, which changes for each successful OTAA Join. This indicates that all was fine and accepted, and indeed you’re seeing the Join Accept in the gateway Traffic. (I assume it’s like this as the network server needs to enhance the Join Accept with a choice for a gateway, and either RX1 or RX2, and add a timestamp accordingly. Those are details that the application does not know about.)

Thanks cslorabox, this is helpful as I didn’t know this.

However, I am still trying to understand where exactly the delay in communication occurs, what can be done to get it back to how it was a few days ago, and why it affects this device and not others on the same network? I’m a total beginner with LoRa, however this is my understanding of the Log File…

  • 11:39:02 Join request received at Gateway from Node
  • 11:39:03 Join request sent from Gateway to TTN over 3G backhaul.
  • 11:39:05 Join request acknowledge message from TTN received back at Gateway
  • 11:39:08 Another message sent from Gateway to TTN (not sure what this is)
  • 11:39:09 Another acknowledge message from TTN received at Gateway (not sure what this is?)
  • 11:39:10 Join accept received from TTN (hurrah!)
  • 11:39:10 The packet is dropped because we whole process took too long (8 seconds)?

Looks like the longest gap is (3) seconds between 11:39:05 and 11:39:08? I’m not quite sure why it took so long?

Thanks again - apologies as I’m a little clueless with this stuff.

Thanks arjvanb - this is good to hear. So basically the only problem is that everything took too long (over 8 seconds)?

Yes.

Are those using OTAA too, so: do those rely on downlinks? (Once joined successfully, downlinks are probably not an issue any more.)

Just as an aside, as for understanding the log: the logging below shows that the Join Request was received/forwarded with counter 2,010,521,172, and in the Join Accept was told to transmit at 2,016,521,172. So, TTN has commanded the gateway to transmit the Join Accept 2016521172 - 2010521172 = 6000000 microseconds after forwarding the Join Request (so, TTN is using RX2). And 11:39:10 - 11:39:02 is much more than those 6 seconds.

I guess we’d need to see both the gateway logs and screenshots from TTN Console for a single join attempt, and would need to know if the times in the log and in TTN Console are in sync, to see where the delays occur…

1 Like

A bit of an aside, as clearly latency is an issue with the downlinks arriving too late (possibly/probably also indicating that the uplinks take too long to arrive at TTN):

This might actually be weird. Assuming the device does not do an OTAA Join for each of its uplinks (don’t!), it should have no reason to initiate a new join (immediately) after a gateway was rebooted. Also, when not doing any downlinks, latency is not an issue. So, if all this started due to rebooting the gateway, then apparently the device requires downlinks to work, which might have made it reboot itself when it saw that it got no downlinks? Like: does it send confirmed uplinks? Also ADR might make it detect that downlinks are missing for some extended period?

So: how soon after the gateway’s reboot did the problems start? (And how often is the device transmitting?) Why was the gateway rebooted?

1 Like

Thanks arjanvanb,

Yes all the devices we have are OTAA. The other trial device we have installed is a NAS pulse reader - which works fantastically. Both these devices were originally activated in the office using OTAA with an ethernet backhaul. As I mentioned earlier, in the field we have a 3G backhaul on the Gateway which is potentially slower.

Thank you. I let me see if I can capture a single join attempt in full from all angles later today.

Thanks for your reply

We currently have the Tek766 configured to confirm every 4th uplink. The factory setting for this device is an ACK every uplink.

The device is currently setup with ADR

Immediately after reboot

The Tek766 is transmitting every 30 minutes, the NAS pulse is transmitting every hour.

That’s a long story - Kerlink Wirnet Stations do not seem to work well on 3G backhauls (on ethernet they perform perfectly). The Gateway software does not seem to be aware when it drops the connection to TTN. The Wirnet is visible on Wanesy but not on TTN. A quick reboot makes the Wirnet visible on TTN again. The solution with Kerlink Support was to set up some form of cron job to automatically restart the Gateway packet forwarder every 30 minutes. Before this we were rebooting the gateway several times a day. Perhaps this is a subject for discussion in another post, however for the moment the solution provided by Kerlink seems to work. Restarting the packet forwarder every 30 minutes seems to take the Gateway about 2 seconds.

Do you still see proper downlinks for confirmed uplinks of other devices?

Does anyone think that regular downlinks (using RX1 of 1 second, RX2 of 2 seconds) might have a different latency than OTAA downlinks (RX1 of 5 seconds, RX2 of 6 seconds)? Like maybe TTN delegates regular downlinks to the gateway a bit earlier (compared to the transmission time), or maybe some intermediate network components might still be active for shorter RX intervals?

So earlier you rebooted the full gateway a few times per day (which also restarted the 3G connection), and now you’re only restarting the packet forwarder every 30 minutes (which does not affect the 3G connection)?

If missing downlinks (for ADR or the confirmed uplinks) make the device start a new join, then I’d say you should have seen the same problems in the past, if the 3G latency was not much different then. But as the problem only started (immediately) after introducing the automatic restart of the packet forwarder, I’m tempted to say that somehow the (3G?) latency was increased when something changed in that gateway.

If your backend keeps track of the frame counters, then you can see how often the device has re-joined in the past (which would reset the counters).

But I guess all that doesn’t help fixing the problem.

(Asides: TTN allows for at most 10 downlinks per day, but that’s not enforced yet. Likewise, at SF12 it only allows for 1 message per hour, when only sending 3 bytes… But maybe it has dropped to SF12 as it’s not receiving the downlinks. Also, if the device has been joining a lot then at some point you might want to read OTAA shows "Activation DevNonce not valid: already used". But all that is unrelated to your current problem.)

1 Like

OK, so here (hopefully) I have captured a complete join request from all angles…

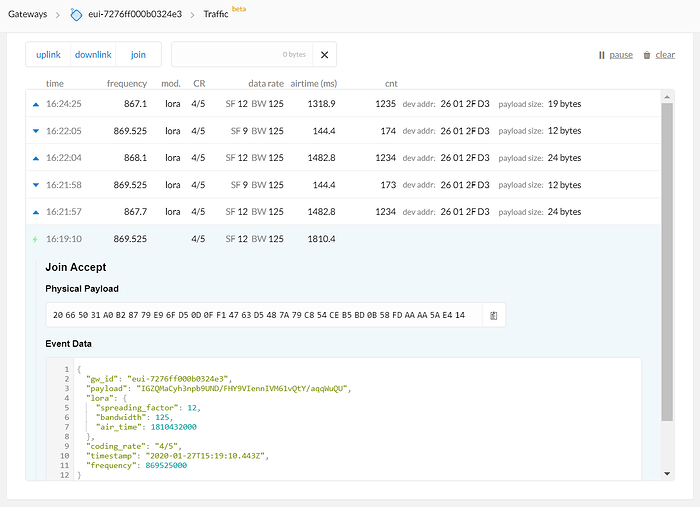
Let’s start with the TTN Gateway Console (note there are uplinks and downlinks from other devices that work fine)…

Here is the JOIN REQUEST

Here is the JOIN ACCEPT

On the Application Console for the device, here is the ACTIVATION

I have pasted the JSON from all three transmissions here…

JOIN REQUEST

{
  "gw_id": "eui-7276ff000b0324e3",
  "payload": "AIAhAADwe04kGyMAAAB7TiSfts6KfHs=",
  "dev_eui": "244E7B000000231B",
  "lora": {
    "spreading_factor": 12,
    "bandwidth": 125,
    "air_time": 1482752000
  },
  "coding_rate": "4/5",
  "timestamp": "2020-01-27T15:19:05.441Z",
  "rssi": 0,
  "snr": 11.8,
  "app_eui": "244E7BF000002180",
  "frequency": 868300000
}

JOIN ACCEPT

{
  "gw_id": "eui-7276ff000b0324e3",
  "payload": "IGZQMaCyh3npb9UND/FHY9VIennIVM61vQtY/aqqWuQU",
  "lora": {
    "spreading_factor": 12,
    "bandwidth": 125,
    "air_time": 1810432000
  },
  "coding_rate": "4/5",
  "timestamp": "2020-01-27T15:19:10.443Z",
  "frequency": 869525000
}

DEVICE ACTIVATION

{
  "time": "2020-01-27T15:19:05.437680347Z",
  "frequency": 868.3,
  "modulation": "LORA",
  "data_rate": "SF12BW125",
  "coding_rate": "4/5",
  "gateways": [
    {
      "gtw_id": "eui-7276ff000b0324e3",
      "timestamp": 3829093340,
      "time": "2020-01-27T15:19:04.397995Z",
      "channel": 6,
      "snr": 11.8
    }
  ]
}

Finally, here is the extract from the Kerlink Lora.log file for the packet that ends in the usual “Packet REJECTED, timestamp seems wrong, too much in advance”.

Jan 27 15:19:04 Wirnet local1.info lorafwd[9202]: <6> Received uplink message: 
Jan 27 15:19:04 Wirnet local1.info lorafwd[9202]: <6> | lora uplink (40100B8D), payload 23 B, channel 868.3 MHz, crc ok, bw 125 kHz, sf 12, cr 4/5
Jan 27 15:19:04 Wirnet local1.info lorafwd[9202]: <6> | Join Request, JoinEUI 244E7BF000002180, DevEUI 244E7B000000231B, DevNonce 46751
Jan 27 15:19:04 Wirnet local1.info lorafwd[9202]: <6> |  - radio (00000106)
Jan 27 15:19:04 Wirnet local1.info lorafwd[9202]: <6> |   - demodulator counter 3829093340, UTC time 2020-01-27T15:19:04.397995Z, rssi -68.1 dB, snr 10.5< 11.75 <14 dB
Jan 27 15:19:04 Wirnet local1.info lorafwd[9202]: <6> Uplink message (3CF3) sent
Jan 27 15:19:05 Wirnet local1.info lorafwd[9202]: <6> Uplink message (3CF3) acknowledged in 1185.27 ms
Jan 27 15:19:10 Wirnet local1.info lorafwd[9202]: <6> Heartbeat (3D40) sent
Jan 27 15:19:10 Wirnet local1.info lorafwd[9202]: <6> Downlink message (E332) received
Jan 27 15:19:10 Wirnet local1.info lorafwd[9202]: <6> Received downlink message: 
Jan 27 15:19:10 Wirnet local1.info lorafwd[9202]: <6> | lora downlink (0000E332), payload 33 B, required 1, preamble 8 B, header enabled, crc disabled, polarity inverted
Jan 27 15:19:10 Wirnet local1.info lorafwd[9202]: <6> | Join Accept
Jan 27 15:19:10 Wirnet local1.info lorafwd[9202]: <6> |  - radio (00000000), channel 869.525 MHz, bw 125 kHz, sf 12, cr 4/5, power 27 dB
Jan 27 15:19:10 Wirnet local1.info lorafwd[9202]: <6> |   - transmission (00000000), priority 1, on counter 3835093340
Jan 27 15:19:10 Wirnet local1.info lorad[858]: <6> Received downlink message
Jan 27 15:19:10 Wirnet local1.err lorad[858]: <3> Packet REJECTED, timestamp seems wrong, too much in advance (current=3835529449, packet=3835093340, type=0)
Jan 27 15:19:10 Wirnet local1.err lorad[858]: <3> Failed to enqueue downlink message
Jan 27 15:19:10 Wirnet local1.info lorafwd[9202]: <6> Received uplink message: transmission event (0000E332 / 00000000), status "Bad timing"
Jan 27 15:19:10 Wirnet local1.info lorafwd[9202]: <6> Downlink message (E332) acknowledged

Any support in figuring out where the timing is going wrong is highly appreciated.

Regards

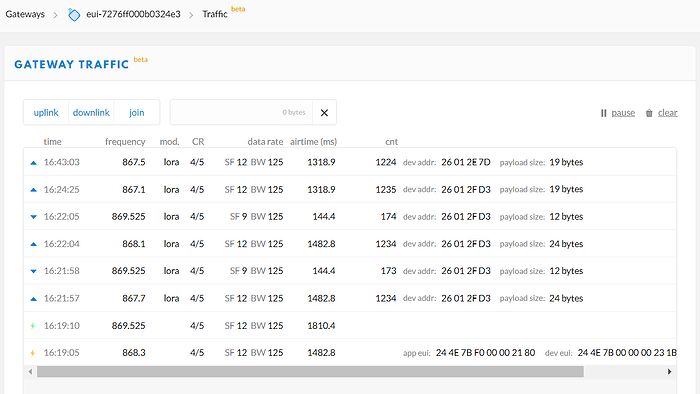
Yes, here is some traffic on the same Gateway for two other nodes.

The message interaction appears to be very quick…

These other nodes seem to be fine - is this an indication the problem is not with the Gateway?

Thanks again for helping us with this - I am aware we are taking up a lot of your precious time, it is appreciated.

This is an indicator the connection suffers from too large delays. That is not something TTN can fix. However, as this started after a reboot of the gateway (was it repositioned as well?) it would be interresting to see what happens if you reboot it again. Preferably with a few minutes between total power down (which takes some time on a kerlink due to the build in backup battery) and re powering it.

Did you see any messages concerning those downlinks on the gateway?

Depending on the amount of traffic available for the gateway each month you could try running PING to a known working (and responding) IP in parallel to the packet forwarder to check if that makes any difference. We have seen telcos where packets suffered from increasing turn around times on low traffic links before (on this forum).

1 Like

Like @kersing asked: can you confirm that these downlinks are actually accepted by the gateway?

Though a DevAddr is not unique, it seems that the 0x26012FD3 device is sending 24 bytes SF12 uplinks at 16:21:57, 16:22:04 and 16:24:25. That means it’s either not adhering to neither the maximum duty cycle (if applicable in your country), nor the TTN Fair Access Policy (which would allow for less than one such message per hour), or did not receive the downlink and is trying again. And again.

Doesn’t the application’s/device’s Data page show a “retry” in TTN Console? And am I right to assume that those devices are not Tek766 sensors, as they apparently do not initiate a new OTAA Join when not receiving the confirmation or when not seeing some ADR response every now and then?

I think all of the following does not help much, if at all. But here goes, just in case:

Like already noted by @kersing, this already tells you that the total latency is 1.2 seconds. A quick search shows much better values for some others:

Just to confirm that TTN is doing okay, assuming that the timestamps in TTN Console and the gateway are almost in sync, we see:

  • The 15:19:04 Join Request is received by TTN at 15:19:05.441Z. If the clocks are perfectly in sync, lacking the milliseconds in the gateway log that might show it’s been on the network between 0.45 up to 1.44 seconds.

  • It is accepted by the application at 15:19:05.437680347Z.

  • The Join Accept is delegated to the gateway at 15:19:10.443Z, so handling/scheduling in TTN took 5.002 seconds. It’s using 869.525000 MHz, hence is using RX2 which is 6 seconds for an OTAA Join, allowing for almost 1 second of latency. (The RX2 is also confirmed by the 6 seconds difference for the counters in the gateway log, being 3,829,093,340 for the Join Request and 3,835,093,340 in the Join Accept.) So, TTN does not seem to be the bottleneck here. (Well, at least not TTN’s network server; other components might still introduce some latency within TTN itself.)

  • The Join Accept is received at the gateway at 15:19:10, which for perfectly synced clocks would indicate it’s been on the network for 0 up to 0.557 seconds. It claims this is 3835529449 - 3835093340 = 0.436 seconds too late (if the gateway would need zero processing time itself).

I guess one could use some ethernet connected gateway to see if the timestamps in TTN Console and the gateway are almost in sync. Above, as the Join Accept is logged at 15:19:10 in both TTN and the gateway, one might conclude that the worst latency is in receiving the Join Request (from gateway to TTN), not in receiving the Join Accept (from TTN to gateway). But I’d assume this just indicates that the clocks are off a bit, so it’s simply impossible to compare the timestamps.

1 Like

This has come up before. The actual gateway hardware only has a buffer for a single downlink packet, armed to transmit at the programmed timestamp. If a (5 or 6 second delay) join accept packet is loaded into the SX130x chip well in advance, and then an ordinary uplink-downlink cycle (1 or 2 second spacing) for another node occurs, loading in that packet to transmit earlier will wipe out the join accept packet.

To work around this, TTN servers seem to hold packets and not push them out to the gateway until nothing else could need to be sent first. Unfortunately that means that no matter how long the TX to RX spacing, there will still be less than a second allowed for the packet to reach the gateway and get loaded into the radio chip.

More recent generations of packet forwarder software maintain a software queue of packets to transmit and load them into the radio “just in time” (ie, the JIT queue). This allows a network to push packets to gateways out of order. But it’s not behavior that the network server assumes or makes use of. And even if a network server did use that, it would only fix the join accept loop - downlinks to maintain ADR state would still be broken.

High backhaul latency is simply not something that TTN in the present configuration can work with.

Some valid points were raised about possible keep-alive traffic for the mobile data backhaul, that’s an option if it’s possible to load custom software onto a gateway (especially if clocks are reliable enough to predict when a node will next uplink and so “warm up” the backhaul network a few seconds in advance). Worth noting that typically there’s a status packet every 30 seconds anyway.

Another option if the backhaul cannot be fixed but which would be off topic here - would be to run a private network, either with large delays even for ordinary tx-rx cycles, a JIT queue in the packet forwarder, and server software configured to push out downlink packets towards the gateway immediately, or even to potentially do the ordinarily inadvisable thing that some of the gateway vendors do as a demo, and run the network server software in the gateway itself. The latter means you can only have one gateway in your network, but it keeps all of the real time requirement local - most applications with sparse packet intervals can tolerate ten seconds of delay in getting the ultimate conclusion of a decrypted and validated application level message pushed to whatever system consumes that.

While all of that is off-topic, to be fair about it, having a nominally public gateway that is too laggy to actually work isn’t of all that much benefit to TTN, in a way it is almost a detriment as in any situation where another gateway might be in range, if the laggy one is receiving someone else’s node signal more strongly it can effectively deny service by getting itself elected to send downlinks it can’t actually push out in time. Thus while it would be possible to use LoRaWAN and TTN in a static way (ABP, fixed data rate manually tuned to conditions) doing so would be about as bad for the community network as those “single channel fakeways” everyone hates.

Thanks to everyone for the support.

I don’t know if it helps but I received this message from Kerlink who seem to advise the following…

Please, ask to TTN to increase the network delay constraint. Your backhaul connection is on GSM, the latency should be around one second. The TTN LNS (the things network lora network server) must anticipate the network latency and send the packet earlier to the gateway to be sure the gateway has got it in time ans schedule the transmission.

Here is the full message…

Hello Ben,

The date is provided by the LNS. If the gateway was configured in 2033, the message would be “too late” not “too much in advance”.

If you want to be sure, connect to the gateway using a ssh connection, or the shell acces in WMC, and type the commande “date”. You will see the date configured on the gateway.

I did it and confirm:
Connected to 7276FF000B0324E3
[root@Wirnet_0B0324E3 ~]# date
Thu Jan 30 13:20:56 UTC 2020
[root@Wirnet_0B0324E3 ~]#

The value displayed in the logs is not an epoch value. It’s a differential between the "current " and the “packet”, the value is a counter incremented monoticaly in the sx1301 (lora modem chipset).

Jan 30 11:34:52 Wirnet local1.info lorad[858]: <6> Received downlink message
Jan 30 11:34:52 Wirnet local1.err lorad[858]: <3> Packet REJECTED, timestamp seems wrong, too much in advance (current=469278659, packet=468946668, type=0)
Jan 30 11:34:52 Wirnet local1.err lorad[858]: <3> Failed to enqueue downlink message

468946668 - 469278659 = 331 991 us = 331ms.
It seems that receiving the packet 331 ms before sending it was too late for the gateway.

The average ping is higher. I calculated 1093ms with the sample below (excel file attached).

[root@Wirnet_0B0324E3 ~]# ping sharedwmc.wanesy.com
PING sharedwmc.wanesy.com (52.211.101.176): 56 data bytes
64 bytes from 52.211.101.176: seq=0 ttl=38 time=288.005 ms
64 bytes from 52.211.101.176: seq=1 ttl=38 time=319.007 ms
64 bytes from 52.211.101.176: seq=2 ttl=38 time=2725.795 ms
64 bytes from 52.211.101.176: seq=3 ttl=38 time=2279.626 ms
64 bytes from 52.211.101.176: seq=4 ttl=38 time=1528.755 ms
64 bytes from 52.211.101.176: seq=5 ttl=38 time=568.286 ms
64 bytes from 52.211.101.176: seq=6 ttl=38 time=313.339 ms
64 bytes from 52.211.101.176: seq=7 ttl=38 time=284.701 ms
64 bytes from 52.211.101.176: seq=8 ttl=38 time=2230.032 ms
64 bytes from 52.211.101.176: seq=9 ttl=38 time=1258.381 ms
64 bytes from 52.211.101.176: seq=10 ttl=38 time=1847.710 ms
64 bytes from 52.211.101.176: seq=11 ttl=38 time=1168.046 ms
64 bytes from 52.211.101.176: seq=12 ttl=38 time=887.530 ms
64 bytes from 52.211.101.176: seq=13 ttl=38 time=1185.561 ms
64 bytes from 52.211.101.176: seq=14 ttl=38 time=1084.885 ms
64 bytes from 52.211.101.176: seq=15 ttl=38 time=1245.255 ms
64 bytes from 52.211.101.176: seq=16 ttl=38 time=1588.507 ms
64 bytes from 52.211.101.176: seq=17 ttl=38 time=857.839 ms
64 bytes from 52.211.101.176: seq=18 ttl=38 time=301.155 ms
64 bytes from 52.211.101.176: seq=19 ttl=38 time=1922.653 ms
64 bytes from 52.211.101.176: seq=20 ttl=38 time=1645.833 ms
64 bytes from 52.211.101.176: seq=21 ttl=38 time=801.202 ms
64 bytes from 52.211.101.176: seq=22 ttl=38 time=300.453 ms
64 bytes from 52.211.101.176: seq=23 ttl=38 time=1780.507 ms
64 bytes from 52.211.101.176: seq=24 ttl=38 time=1349.136 ms
64 bytes from 52.211.101.176: seq=25 ttl=38 time=1197.466 ms
64 bytes from 52.211.101.176: seq=26 ttl=38 time=566.599 ms
64 bytes from 52.211.101.176: seq=27 ttl=38 time=515.910 ms
64 bytes from 52.211.101.176: seq=28 ttl=38 time=875.279 ms
64 bytes from 52.211.101.176: seq=29 ttl=38 time=814.454 ms
64 bytes from 52.211.101.176: seq=30 ttl=38 time=774.767 ms
64 bytes from 52.211.101.176: seq=31 ttl=38 time=933.025 ms
64 bytes from 52.211.101.176: seq=32 ttl=38 time=522.294 ms
64 bytes from 52.211.101.176: seq=33 ttl=38 time=622.578 ms
64 bytes from 52.211.101.176: seq=34 ttl=38 time=317.875 ms
64 bytes from 52.211.101.176: seq=35 ttl=38 time=2500.335 ms
64 bytes from 52.211.101.176: seq=36 ttl=38 time=2090.557 ms
64 bytes from 52.211.101.176: seq=37 ttl=38 time=1117.819 ms
64 bytes from 52.211.101.176: seq=38 ttl=38 time=283.297 ms
64 bytes from 52.211.101.176: seq=39 ttl=38 time=286.419 ms
64 bytes from 52.211.101.176: seq=40 ttl=38 time=1336.761 ms
64 bytes from 52.211.101.176: seq=41 ttl=38 time=1396.541 ms

Please, ask to TTN to increase the network delay constraint. Your backhaul connection is on GSM, the latency should be around one second. The TTN LNS (teh things network lora network server) must anticipatethe network latency and send the packet earlier to the gateway to be sure the gateway has got it in time ans schedule the transmission.

Please confirm TTN understood the need and will anticipate the network latency on downlink messages, so I’ll close this ticket. The job is on server side, no workaround is possible to respect the LoRaWAN.

Best regards,

David Laronche

–
Helpdesk Kerlink
1, rue Jacqueline Auriol
35235 THORIGNÉ FOUILLARD
+33 (0)2 99 12 29 00
helpdesk@kerlink.fr

While I personally believe this would have been a good idea from the start, it’s not going to happen as a change to the already deployed system on your request.

Pretty much everything would have to change.

Even if things were made very contextual - ABP device records created before “the big switch” getting a 1 second RX and those created later getting a longer one, legacy devices would still break when they encountered a slow gateway such as yours. And all devices would break in the case of slow gateways not reporting a packet forwarder version known to have the jit gateway-side queue, where the queue has to be held on the network side instead.

Thanks everyone for helping out. I was hoping to reach some sort of conclusion or actions to be taken to try to get these devices back online but I don’t get the feeling there is not a simple solution.

The only partial solution I can think of is to remove the device, take it back to the office, let it complete a full JOIN request and ACCEPT to TTN over a faster ethernet backhaul and then take it back to the site to send data.

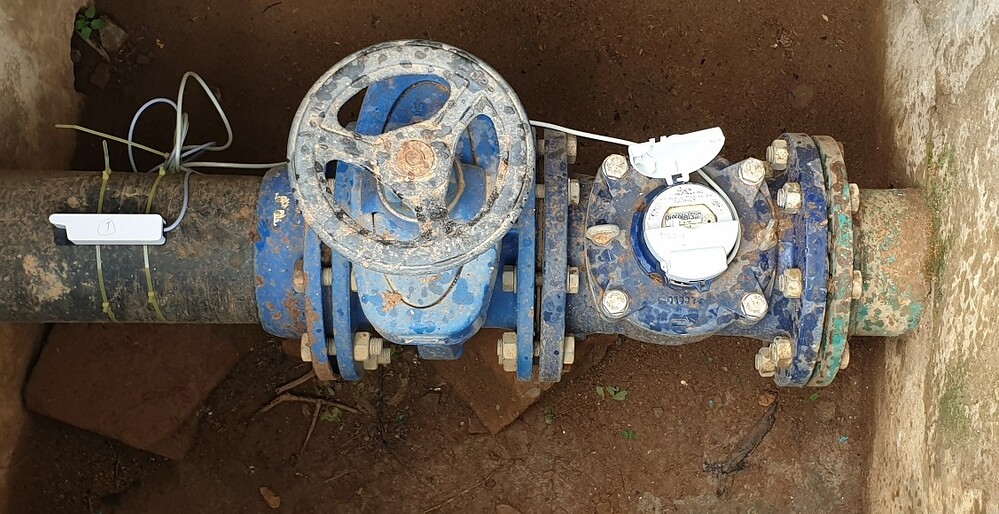
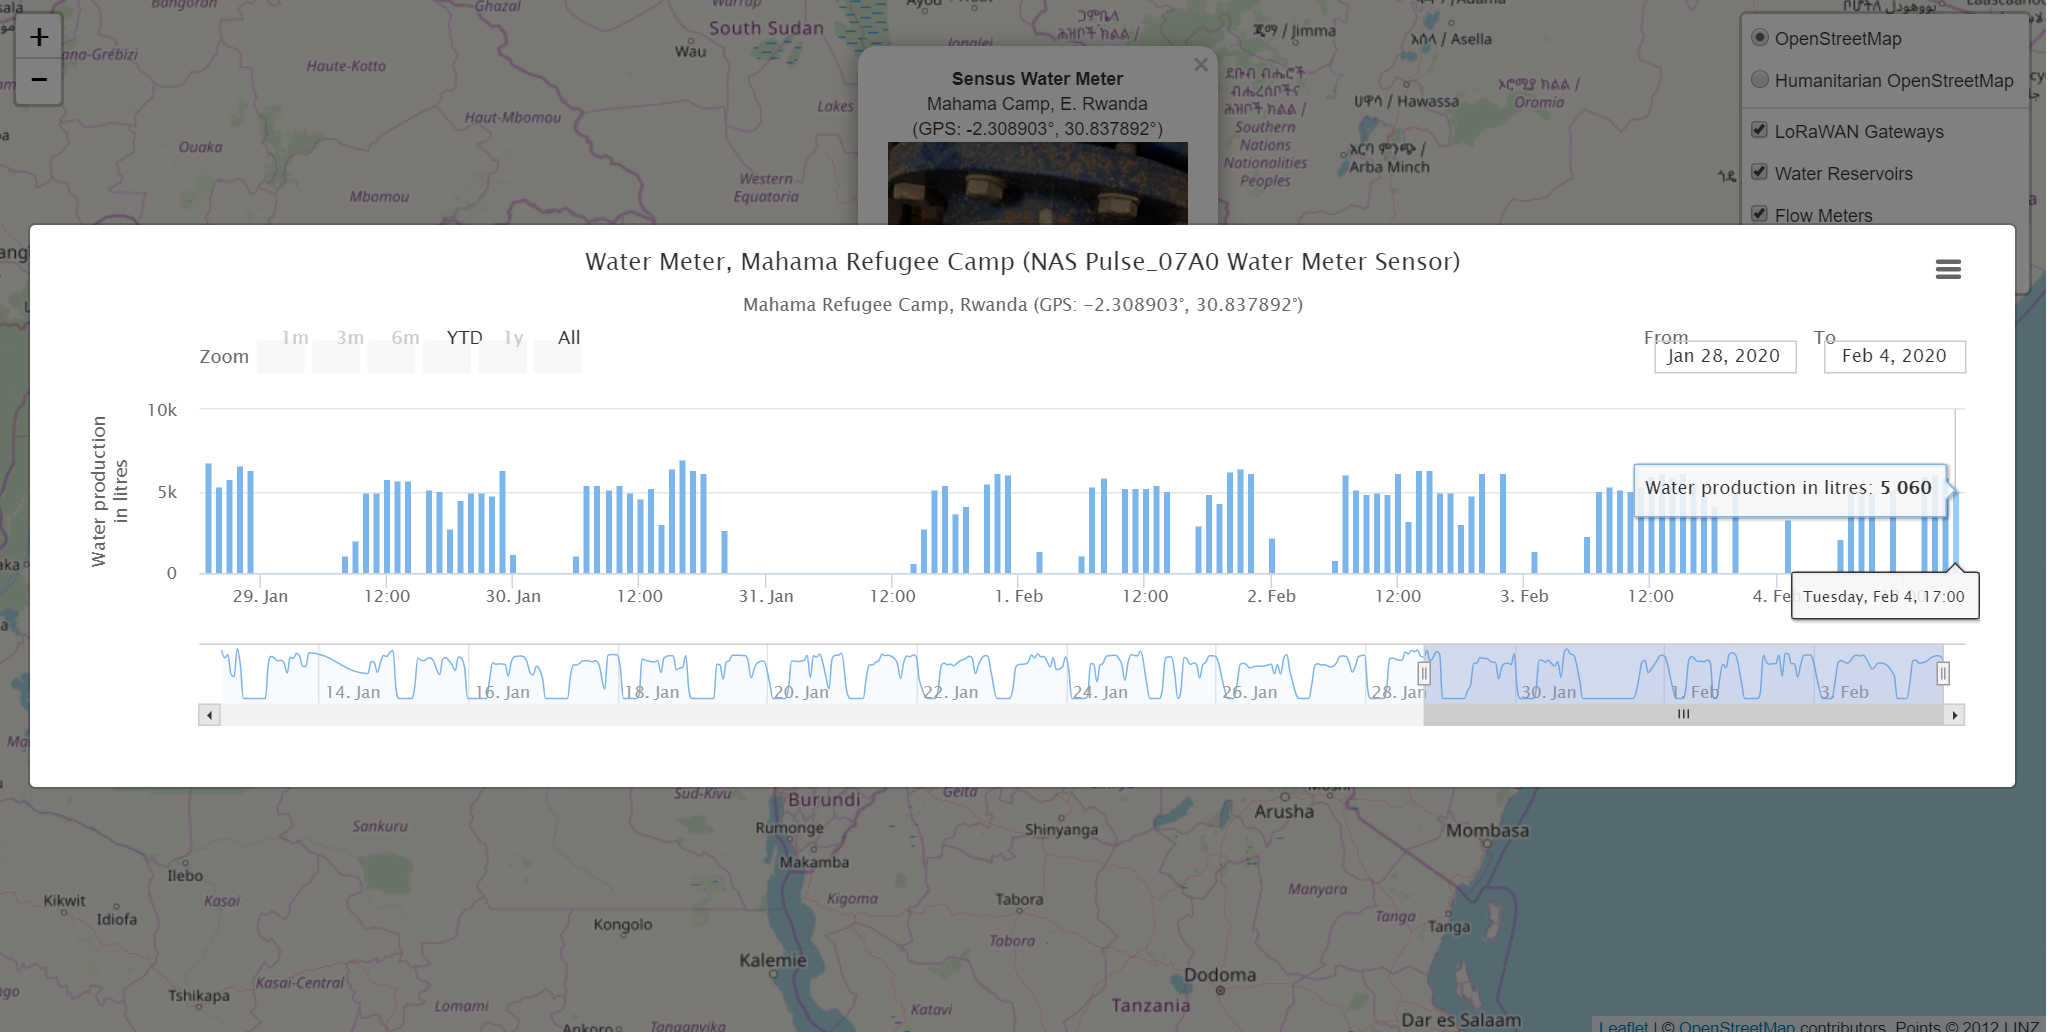
The Gateway is after all working perfectly for normal UPLINKS - for example here is some water pumping data from 10 minutes ago…

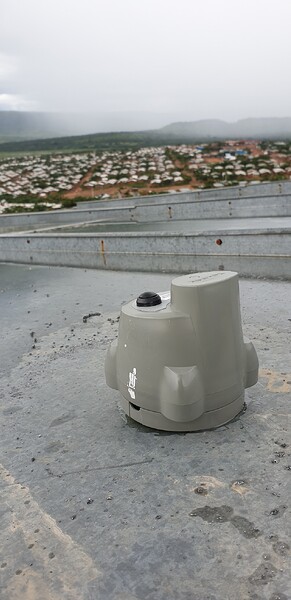
Sensus Water Meter

We don’t want to make the same mistake in other locations so is it fair to say that TTN doesn’t work well over 3G networks? We currently have a roll out of several more Kerlink Gateways in various refugee locations so would it be fair to put a hold on installing in any more locations where there is not an ethernet backhaul?

Thanks as always.