we’ve just migrated all our apps with over 140 nodes and gateways (14) over onto TTNv3. A couple of steep learning curves here and there - but we have come through the other side!
As part of all the Googling around searching for answers I stumbled on a chart (it has got to be on the TTN website) that shows the total number of TTNv2 gateways and the TTNv3 gateways at particular dates. Obviously the number of TTNv3 gateways is slowly increasing - but only since February 2021. As we changed our 14 gateways over within two days and the number of TTNv3 gateways is comparatively small, I figured I might actually see a small rise in the global chart because of the work that we have been doing. I was just want to see it for my own nerdy satisfaction. Nothing more.
However, can I find that chart? Can I 'eck as like! I have googled, I have gone through my history and I can just can’t find it anywhere.
Two timeline graphs on one page. One showing the TTNv2 and the other graph showing the TTNv3 graphs. Hope someone knows where the link is.
Firsty congrats on the migration exercise - as you noted its challenging in some cases. Secondly we actually recommend that GW owners dont migrate to V3 yet, as the probability is that any other users in your community area, who rely on your GW’s but who are not covered by remaining V2 GW’s will now be stranded. Traffic captured by V3 GW’s is not passed ‘backwards’ to V2 devices & appplications through the PacketBrker, that brings data from V2 GW’s to V3 apps We recommend only migrating GWs to V3 once legacy arrangements have been put in place or devices and apps have been migrated to V3 1st. Even where there are V2 GW’s still available if your, now V3, GW was the ‘closest’ from RF perspective devices and applications may see a significant period of data disruption whilst they realise no longer connected through your GW and mechanisms such as ADR or occational mesage confirmations, trigger a change in device behaviour to move to higher SF’s and or higher Tx powers (and attendant reduced battery life etc.).
Not sure which charts or maps/stats you are refering to either but steady increase from low number is to be expected as the formal move to V3 for TTN was only announced late Jan during the last Virtual TTConf.
Generally the Map count and availability is shown on the TTN home page, or on the associated TTN Map, globally, (recently oscillating around 17200-18200) though given your Welsh location I’m sure you are aware of the TTN UK front page/Map showing current live recently seen GW count (hovering recently around 950 - 1010). The Map generally is planned for a major overhaul in coming weeks/months with option to show V2 & V3 GW’s as well as the current colour coding around active(blue)/recently seen(red) - note if a gw is not seen for around 30 days it ages off the map until next ‘seen’ by the NS backend. Note the new V3 infrastructure is mush more cluster based and distributed, making a centralised GW overview harder to produce (we have asked if Core Team can atleast allow a cluster view). There are no immediate plance for a new global NOC either. Also the number of GW’s shown does not reflect total available or historic GW count as many will have aged off if not seen as mentioned abve, or many go through rebuilds, often implementing new registrations or ID’s (e.g. concentrator from a failed Raspberry Pi based plaform with one MAC based EUI, might get migrated to another system under different EUI if the original Pi fails and a new one instanced - with new MAC Addr etc.) Also a small but significant number of GW’s are set up without users checking the boxes to allow them to be showm publically on the Maps, this is more easily overlooked on the V3 registration so I ask all users to be sure to make their GWs are publically viewable so we know what resources are around.
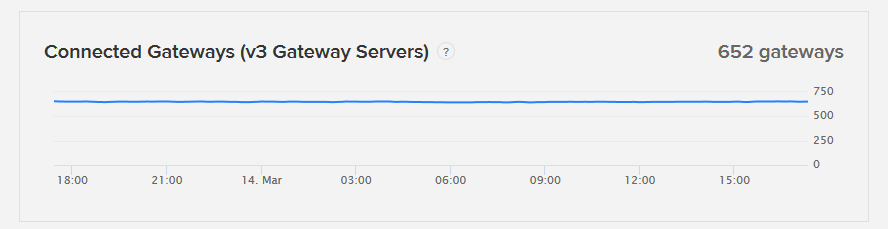
I did note that the TTN status page does (atleast for now) call out a number of V3 GWs connected at any given time.
Note when I looked at this about a week back it was down around 500-510 - so a nice increase even over last week…these can be added to the current approx 17350 GW’s (V2) shown on main map
Perhaps others know where the charts you called out are…?
That’s it - you’ve nailed it - it was the status page. Thanks for the time taken on the full answer. We did note the request about not upgrading the gateways - regretfully we have a large amount of node going out in the next couple of months to rural locations and we didn’t want to have to revisit them if something went wrong. Some of these locations are a 90 minute drive from our office so we didn’t want to mess anything up.

 We recommend only migrating GWs to V3 once legacy arrangements have been put in place or devices and apps have been migrated to V3 1st. Even where there are V2 GW’s still available if your, now V3, GW was the ‘closest’ from RF perspective devices and applications may see a significant period of data disruption whilst they realise no longer connected through your GW and mechanisms such as ADR or occational mesage confirmations, trigger a change in device behaviour to move to higher SF’s and or higher Tx powers (and attendant reduced battery life etc.).