Hello, first off, I know this thread exists: this but I didn’t want to hijack it.
So, the RAK811-h is very un-reliable when connecting to my gateway. I have compaired it to other devices, and everything else seems to work great, it is just the RAK811-h. Before anyone asks, I am running the very latest version of the stable firmware V3.0.0.14.H freshly flashed this evening.
Normally, it takes 3-6 at+join attempts to establish a connection.
When a failure occures I get the error message: error 99. The
in my console (the things stack open source v3.12) I am seeing this under “Recieve join-request”
{
  "name": "ns.up.join.receive",
  "time": "2021-05-17T12:33:31.288419225Z",
  "identifiers": [
    {
      "device_ids": {
        "device_id": "rak",
        "application_ids": {
          "application_id": "cropwatch"
        },
        "dev_eui": "0000101011000001",
        "join_eui": "0000200000001000",
        "dev_addr": "00F7B0A5"
      }
    }
  ],
  "data": {
    "@type": "type.googleapis.com/ttn.lorawan.v3.UplinkMessage",
    "raw_payload": "AAAQAAAAIAAAAQAAERAQAADxsRLffd4=",
    "payload": {
      "m_hdr": {},
      "mic": "Et993g==",
      "join_request_payload": {
        "join_eui": "0000200000001000",
        "dev_eui": "0000101011000001",
        "dev_nonce": "B1F1"
      }
    },
    "settings": {
      "data_rate": {
        "lora": {
          "bandwidth": 125000,
          "spreading_factor": 7
        }
      },
      "data_rate_index": 5,
      "coding_rate": "4/5",
      "frequency": "923800000",
      "timestamp": 4237758724
    },
    "rx_metadata": [
      {
        "gateway_ids": {
          "gateway_id": "ttog",
          "eui": "000080029C2B2AA7"
        },
        "timestamp": 4237758724,
        "rssi": -73,
        "channel_rssi": -73,
        "snr": 8,
        "uplink_token": "ChIKEAoEdHRvZxIIAACAApwrKqcQhKLc5A8aDAibxYmFBhDI79WIASCg7+nwqu8E",
        "channel_index": 3
      }
    ],
    "received_at": "2021-05-17T12:33:31.287521297Z",
    "correlation_ids": [
      "gs:conn:01F5WGN2N024MCK08G7D05BZME",
      "gs:up:host:01F5WGN2NAGBGAREKBHA9C78GZ",
      "gs:uplink:01F5X52BMP2FHVF74D3JTYQ7D0",
      "ns:uplink:01F5X52BMQY0KG9P40VD60NPAB",
      "rpc:/ttn.lorawan.v3.GsNs/HandleUplink:01F5X52BMQG5DDA94CR8RV3MTZ"
    ],
    "consumed_airtime": "0.061696s"
  },
  "correlation_ids": [
    "gs:conn:01F5WGN2N024MCK08G7D05BZME",
    "gs:up:host:01F5WGN2NAGBGAREKBHA9C78GZ",
    "gs:uplink:01F5X52BMP2FHVF74D3JTYQ7D0",
    "ns:uplink:01F5X52BMQY0KG9P40VD60NPAB",
    "rpc:/ttn.lorawan.v3.GsNs/HandleUplink:01F5X52BMQG5DDA94CR8RV3MTZ"
  ],
  "origin": "ea2b6361d534",
  "visibility": {
    "rights": [
      "RIGHT_APPLICATION_TRAFFIC_READ"
    ]
  },
  "unique_id": "01F5X52BMR7QWERMS20VFVTZBT"
}
It will then be direcly followed by a “Drop join-request - Uplink channel not found” message like so:
{
  "name": "ns.up.join.drop",
  "time": "2021-05-17T12:33:31.288464045Z",
  "identifiers": [
    {
      "device_ids": {
        "device_id": "rak",
        "application_ids": {
          "application_id": "cropwatch"
        },
        "dev_eui": "0000101011000001",
        "join_eui": "0000200000001000",
        "dev_addr": "00F7B0A5"
      }
    }
  ],
  "data": {
    "@type": "type.googleapis.com/ttn.lorawan.v3.ErrorDetails",
    "namespace": "pkg/networkserver",
    "name": "uplink_channel_not_found",
    "message_format": "uplink channel not found",
    "code": 5
  },
  "correlation_ids": [
    "gs:conn:01F5WGN2N024MCK08G7D05BZME",
    "gs:up:host:01F5WGN2NAGBGAREKBHA9C78GZ",
    "gs:uplink:01F5X52BMP2FHVF74D3JTYQ7D0",
    "ns:uplink:01F5X52BMQY0KG9P40VD60NPAB",
    "rpc:/ttn.lorawan.v3.GsNs/HandleUplink:01F5X52BMQG5DDA94CR8RV3MTZ"
  ],
  "origin": "ea2b6361d534",
  "visibility": {
    "rights": [
      "RIGHT_APPLICATION_TRAFFIC_READ"
    ]
  },
  "unique_id": "01F5X52BMRDW7Z7C3ZQPEYXCE1"
}
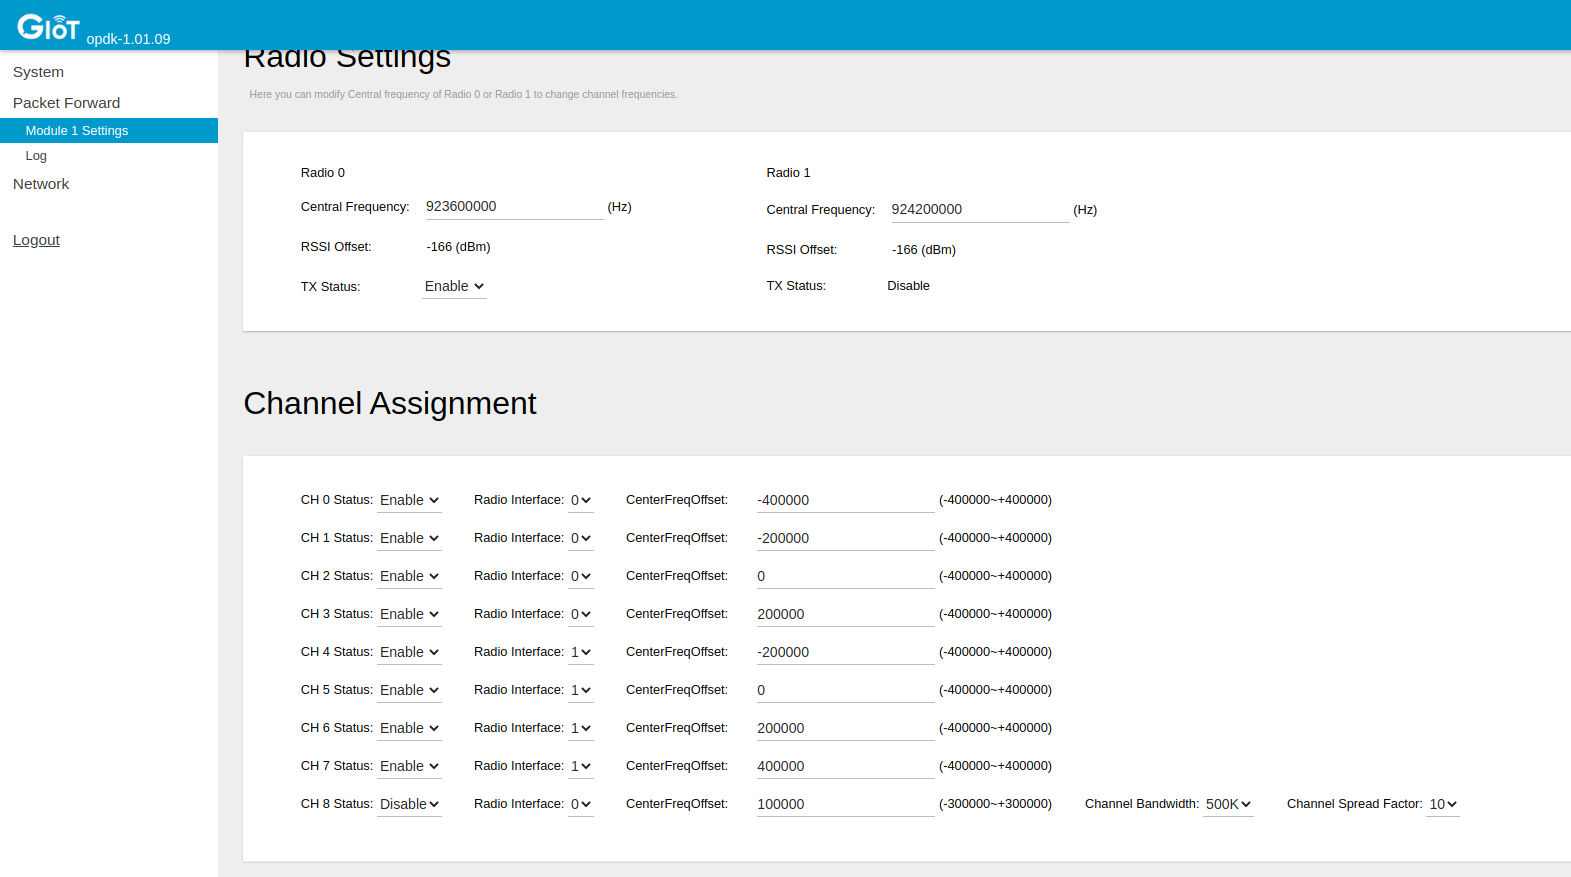
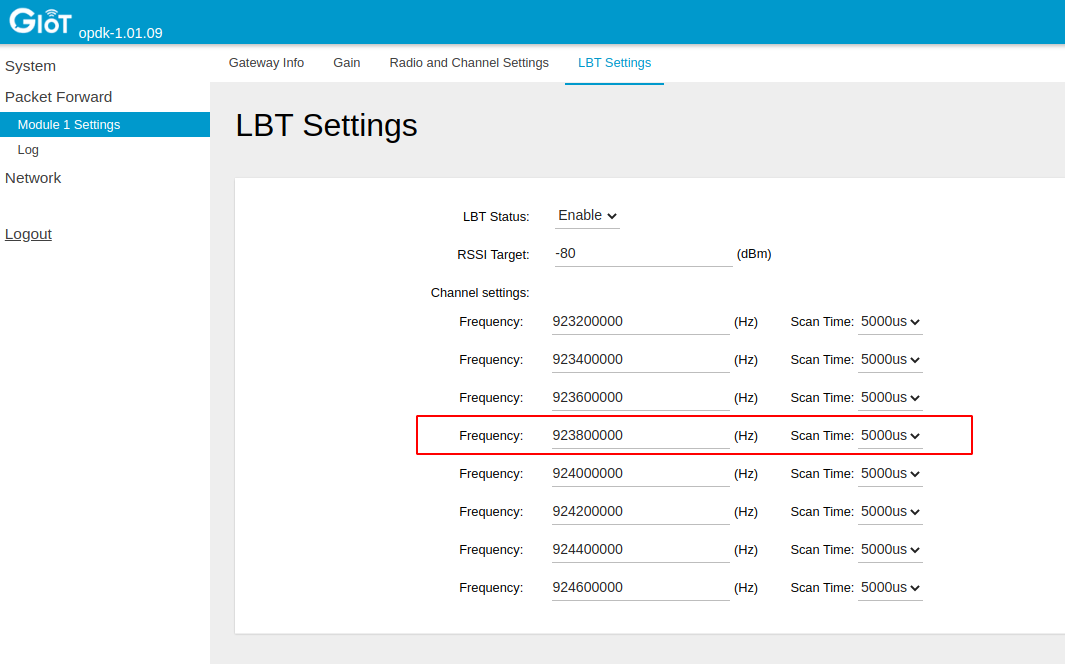
Now, Here is the part where I think I may not understand how this process fully works, If you notice on the “Recieve join-request” claims to be connecting on frequency "frequency": "923800000" Possibly I don’t have the configured in my gateway. Btw, I am connecting on AS923 (JP) so LBT is enabled. Here is my gateway config.
Here is the config of my Gateway (ttog):

As you can see in this picture, I do have 923800… covered. It is easier to see in the LBT Settings page:

So, Here is where I may be mistaken, There are 2 radio interfaces, 0 and 1. I am not sure what the difference is. I do see above, something about Transmit Enabled/disabled, so one may be only send, the other only receive, not sure. can’t find docs on it. Here is where I found the frequencies to set: https://www.thethingsnetwork.org/docs/lorawan/frequency-plans/#as920-923-as1
I am hessitant to make any changes as it is only the RAK811-h chip that has issue connecting, though, possibly there is an issue with my setup, I would like to assume the issue is with me, and not RAK.
While I AM able to establish a connection (after repeated at+join commands) I can transmit some data, and that ALSO only reaches the application. I normally wait 60 seconds before another transmit.
If I check the gateway, I see this error message listed as “Drop uplink message”:
{
  "name": "gs.up.drop",
  "time": "2021-05-17T18:17:36.910442803Z",
  "identifiers": [
    {
      "gateway_ids": {
        "gateway_id": "ttog",
        "eui": "000080029C2B2AA7"
      }
    }
  ],
  "data": {
    "@type": "type.googleapis.com/ttn.lorawan.v3.ErrorDetails",
    "namespace": "pkg/gatewayserver",
    "name": "host_handle",
    "message_format": "host `{host}` failed to handle message",
    "attributes": {
      "host": "cluster"
    },
    "cause": {
      "namespace": "pkg/networkserver",
      "name": "device_not_found",
      "message_format": "device not found",
      "correlation_id": "defa709fd9aa40bd9125490e47b17566",
      "code": 5
    },
    "code": 5
  },
  "correlation_ids": [
    "gs:conn:01F5WGN2N024MCK08G7D05BZME",
    "gs:up:host:01F5WGN2NAGBGAREKBHA9C78GZ",
    "gs:uplink:01F5XRRDC8FSRSDR8J8B8C5GXQ"
  ],
  "origin": "ea2b6361d534",
  "visibility": {
    "rights": [
      "RIGHT_GATEWAY_TRAFFIC_READ"
    ]
  },
  "unique_id": "01F5XRRDCEZK24GSZ50ND11Z6H"
}
If anyone has any info on this, I would really appreciate it.
Thanks a lot,
-Kevin