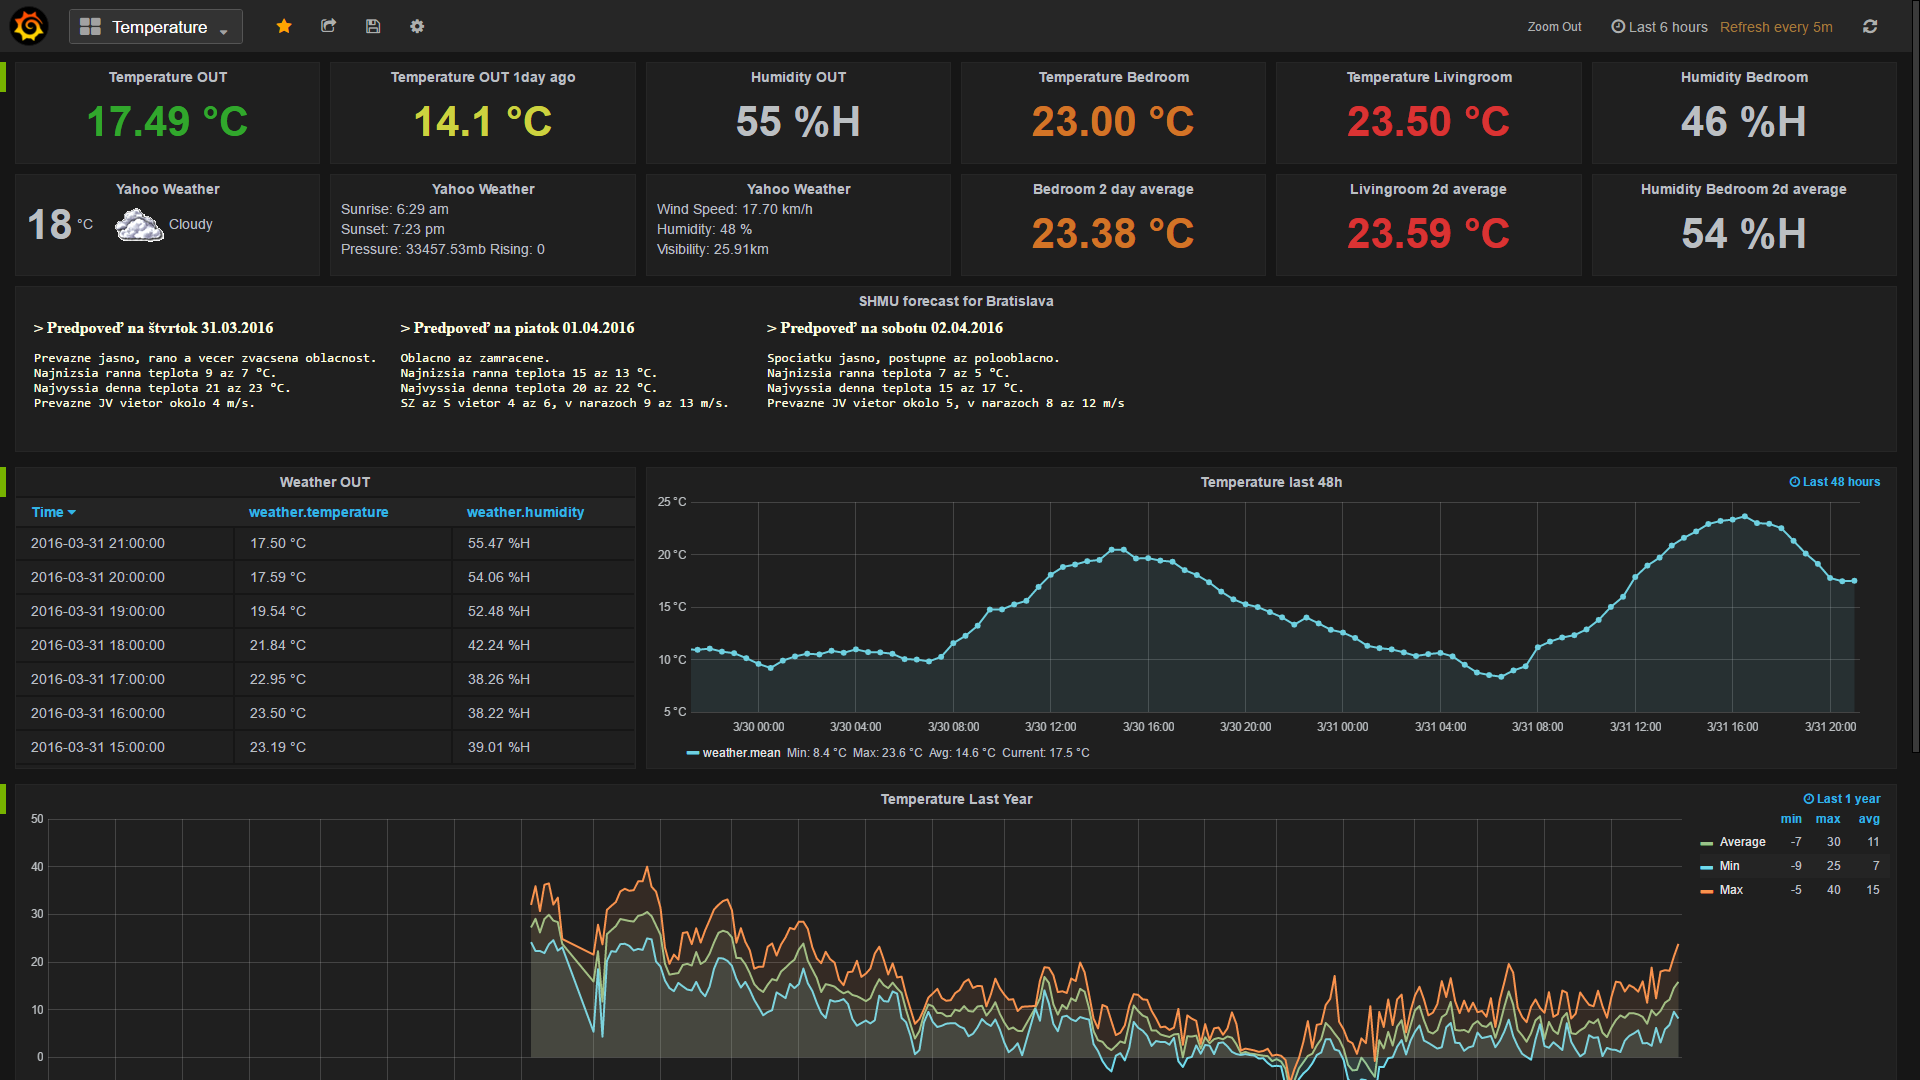
Learn how to make these fancy graphs using Node-RED, InfluxDB and Grafana.
https://www.thethingsnetwork.org/labs/story/store-and-visualize-data-using-influxdb-and-grafana/

Please let me know if you have any improvements to this story.
Learn how to make these fancy graphs using Node-RED, InfluxDB and Grafana.
https://www.thethingsnetwork.org/labs/story/store-and-visualize-data-using-influxdb-and-grafana/

Please let me know if you have any improvements to this story.
This is great thank you!
I recall seeing a link once where someone built a visualisation for gateway statistics (packets, frequency, sf, etc). Is there a labs story on how to build it?
Thanks for the Labs/Story, would it be possible to include/expand it in a way to include a way to decode/show data from a node from another story (Frank Beks “WORKSHOP CREATING A TTN NODE” comes to mind), so that you first can build the same hardware as in Franks story and then connect and visualize the data in this story?
PS: I am looking for some kind of 360° “gauge” in grafana, but can not find one. Would be to build a wind rose to show the wind direction - anyone got a plugin/code for one in grafana?
Hi Caspar, our next ‘Eindhoven Community’ workshop in March will focus exactly on this point (integrating a node in a cloud structure, visualize and publish to other services)!. Stories will be shared, and may be we can arrange something in Hennef 1st of April?
I thought your time in Hennef was limited due to a private thing later on? If my information are right your (i will be helping if you want me to) doing a hardware workshop on april 1st? And i think the time is already very limited for it… I will send you a PM now to, because i think we are derailing this thread from Laurens 
Is there a MS windows version?
Idea:
How to run it on a Pi, i think it should work besides a gateway. So it would be super handy for demos, hackatons and so on.
How to install it on some cloud service for dummies like me.
Hi, I created a database based on influxdb then I installed grafana. I chose data source my database. But I can not get a graph in my dashboard.
can you help me
Never mind… I found the data is in the database under that msg.payload heading(or what ever it’s called in database lingo).
Using this I saw lots of data:
curl -G http://localhost:8086/query --data-urlencode “db=db_lorawan” --data-urlencode “q=SELECT * FROM /.*/ where v= ‘3.45’”
I have all 3 servers running and have a function getting my data from my node( volts, temp, pressure ) but can’t seem to get it into InfluxDb in a way I can see in the database. I tried a string looking like:
“LoRaWAN, node=26011B2F, v=volts t=temperature p=pressure” where volts, temperature and pressure were variables with floating point numbers. And my influxdb out node has msg.payload for the Measurement entry. Idea?
Here are the 3 things I tired:
var msg2 = { payload: msg.payload.length };
msg2.payload = [{
v: volts,
t: temperature,
p: pressure
}];
msg2.payload = [
{
measurement: “node_sensor”,
fields: {
volts: volts,
temp: temperature,
press: pressure
},
tags:{
location:“garden”
},
timestamp: timestamp //new Date()
}];
var measurement = “LoRaWAN,node=26011B2F,”+volts+" “+temperature+” “+pressure+”,"+timestamp;
msg2.payload = measurement;
When I do “SHOW MEASUREMENTS” in the database I just see “msg.payload”
Last year I wrote instructions for a workshop, you might want to check the last step. (The earlier steps are for the now obsolete staging environment, this one is still useful.)
Looking at the code I think you need to add ‘return msg2;’ at the end…
Thank you,
I followed your excellent tutorial but I’m stuck at this point.
In the application details click on “learn how to get data from this app” to get the connection details.
I do not find this instruction in:
Https://console.thethingsnetwork.org/applications/my_application
That is a difference between staging and production, for the new console the username is the application ID, for the password scroll down on the application page and copy the entry to the right of “default key” (use the eye icon to show the text).
The connection is to < Region >.thethings.network where region is the handler string at the top of the page minus ‘ttn-handler-’, so ‘ttn-handler-eu’ would become eu.thethings.network
Dear TTN community,
thanks for this story! We want to take the chance to introduce you to Kotori, a full-stack FOSS data historian integrating InfluxDB, Grafana, Mosquitto, MongoDB, dygraphs, mqttwarn and more with each other.
It offers multi-channel, multi-protocol and multi-tenant data acquisition and data export features and is super easy to install and operate.
The system might be interesting to the whole TTN community for different tasks in the field of measurement data collection and storage, data telemetry, environmental monitoring and beyond. As it was designed to glue best-of-breed FOSS components together, it could be a viable alternative to platforms like Thingspeak or Opensensors.io. However - through its open architecture - adapters to other systems are possible and encouraged.
We appreciate comments and suggestions and will be happy to answer any questions.
With kind regards,
the Kotori developers.
Thanks for the very well documented Tutorial. I just followed it step-by-step and it works. In addition I would like to show the RSSI, SNR and Spreading Factor on the Grafana dashboard. Do I have to configure this in Node-Red? And if yes, can you tell me where and how to do this exactly?
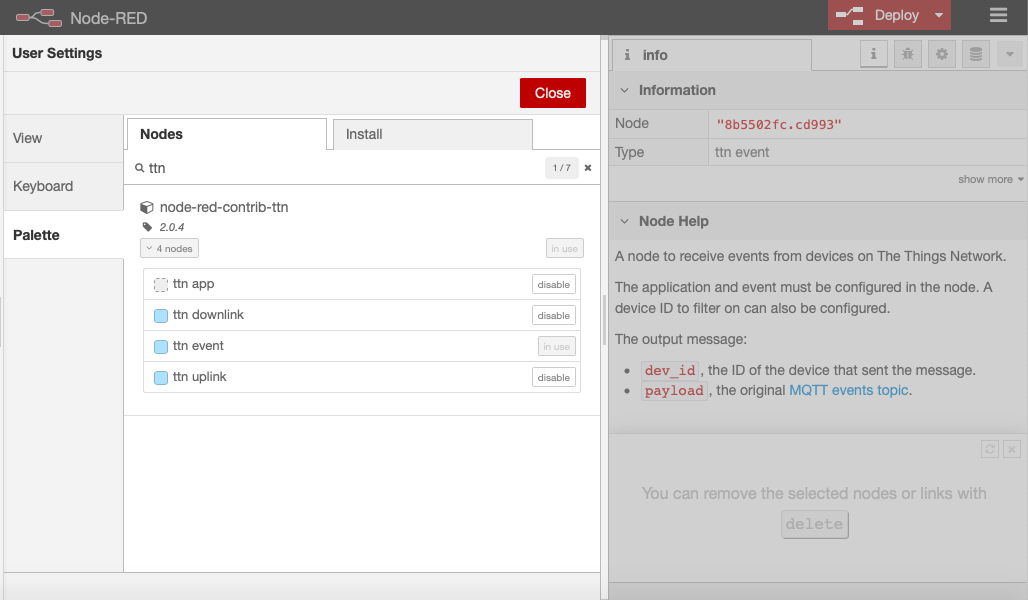
I have got Node-Red and Grafana setup, however I am unable to find the “TTN Message” node as described under the “Setup InfluxDB node on Node-Red” section.
The TTN nodes I have available are:
Input
Output
I am only assuming that “ttn event” is the new “ttn message”.
Below is an image of the installed palette:

It changed from the old version of this plugin to node-red. Now you got nodes for up & downlink traffic and a node for events like joins of a device. So ttn event is not the new ttn message, because in the old message was ttn uplink & ttn event. Mostlikely (you want the payload?) you need the ttn uplink node.
Yep, some other documentation I’ve found uses ttn uplink. Thanks for the explanation.
Is anybody using kotori - with TTN?
Anyone know of any tutorials out there on how to get this on it’s feet with node-red-contrib-ttn now deprecated and TTN V3 around the corner?
Hi @gw_ves
There’s Node Red documentation available, see: Node-RED Integration | The Things Stack for LoRaWAN
For more integrations (including InfluxData), see: Cloud Integrations | The Things Stack for LoRaWAN