Hi,
seems to be an easy question, but I was not able to find an answer.
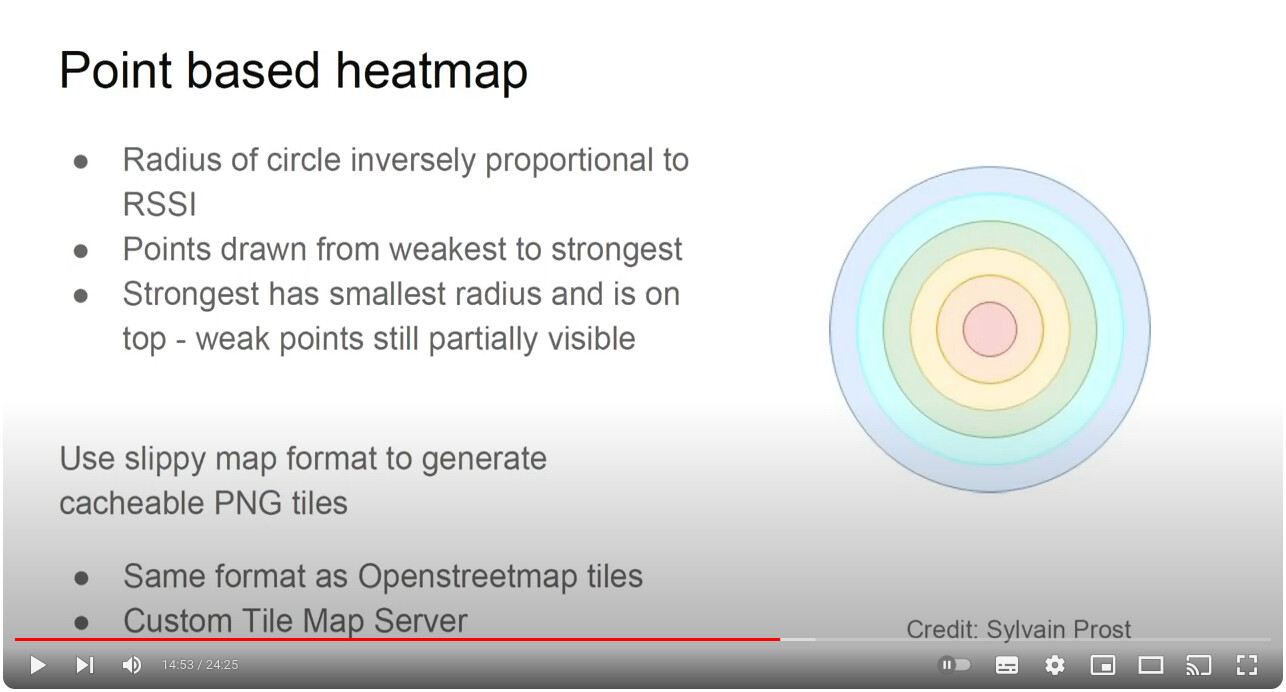
The circles (heatmap mode) representing measured locations, have color and a size. While the color is obvious from the legend (signal strength) I’m not sure what the size of the circles are showing.
GPS accuracy (the larger the circle the less accurate) would make sense to me, but if I look at the measurements here around me it seems that the weaker the signal the larger the circle.
Wouldn’t make too much sense to me.
Can someone enlighten me?
By the way - it seems to me that the beams in beam mode also have different width. But here I’m not sure, since they get wider anyhow the longer they are (I guess that’s the nature of a beam).
While I’m writing this it comes to my mind, that it might be the same with the circles? That they are kind of endpoints of beams and therefore larger the more away from the gateway (and with that in most cases the weaker the signal)?
Thanks Christian
