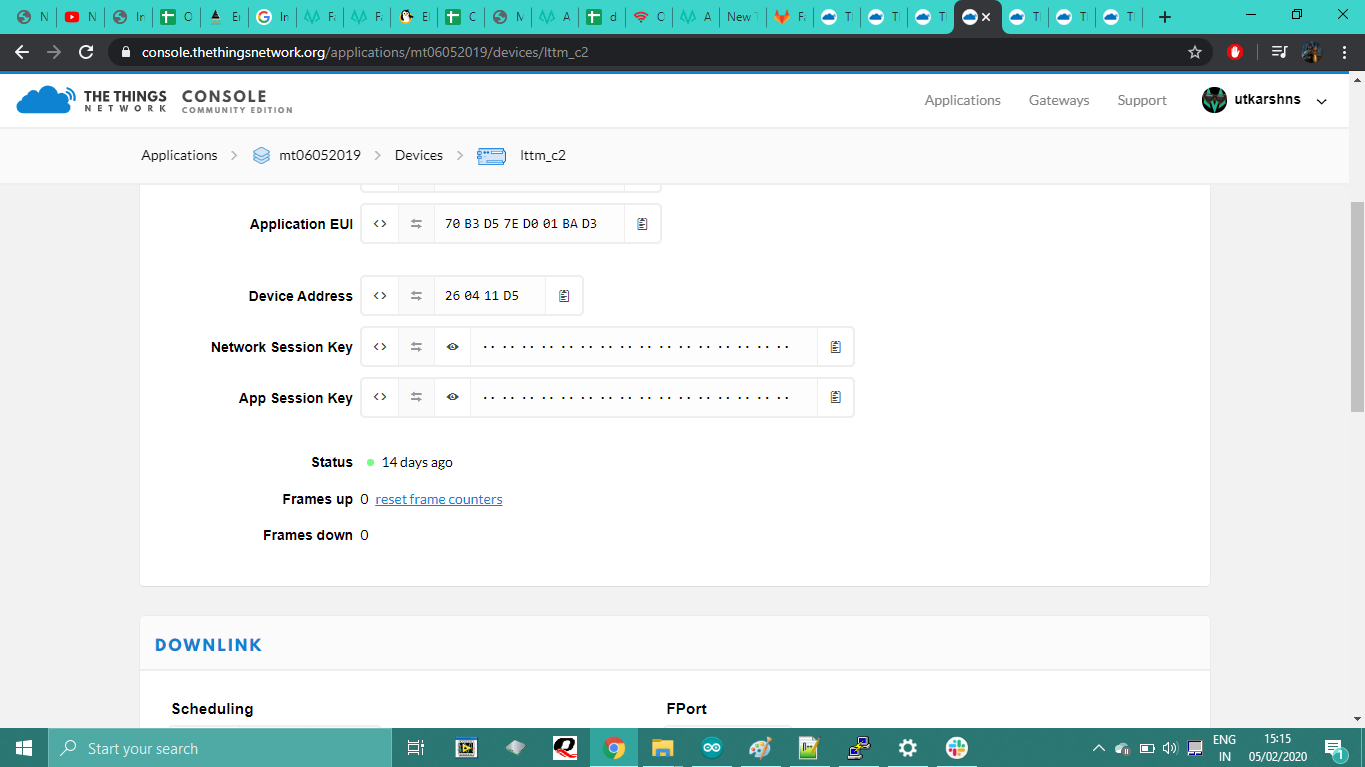
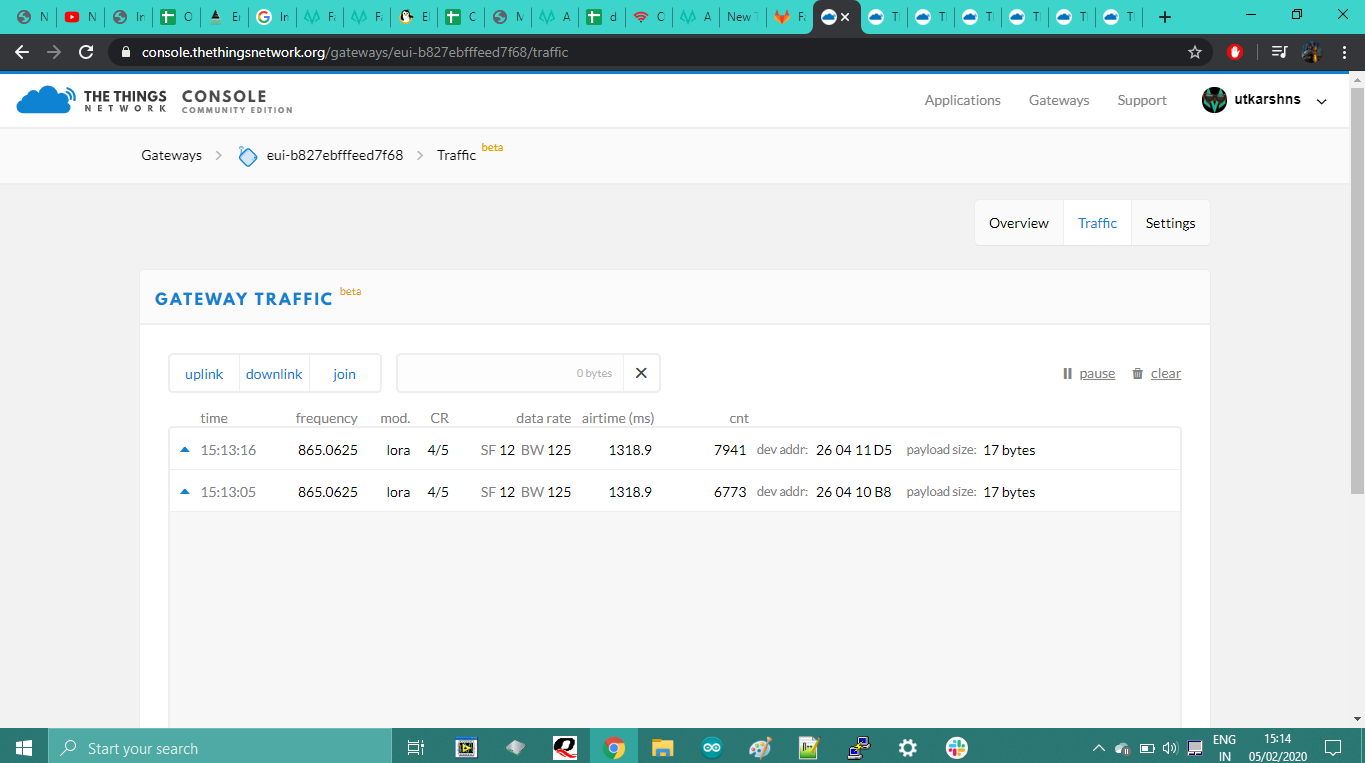
The node are sending the data to gateway as shown in this gateway traffic, but the console is not getting any data from that particular node on the device data page.
The image have been attached to understand the issue better.
Kindly go through this issue and let me know how can we solve the same.
Kindly post additional information on your node. Are you using ABP or OTAA? What software stack? Why is the node sending with SF12 and not a lower spreading factor?
Mode ABP
softwate stack grumpy old pizza (grasshopper lora board)
Murata module. We haven’t specified SF12 anywhere. It has been taken by the library when we uploaded the code.
Thanks and Regards
Check the keys are in the right byte order. If data goes missing between gateway (console view) and application that is 90% of the time the issue.
Counters not matching is the remainder, but that seems unlikely for a device that has them set to 0. (Or was the device operating for a long time and hasn’t it been reset?)
The key are correct and the application is also fine as we have received the data earlier on this exact setup.
The counter doesn’t match because we have reset it manually from the portal.
The node has been in ABP mode always and it was working just fine for about 2 weeks. The node also resets itself every hour.
Why are you resetting the node every hour? That will surely might have an effect on the frame counters, and on ADR (assuming you enabled that; if not: always using SF12 is not allowed). Did you disable the security frame counter checks to make that hourly reset work? (Not recommended, of course, but I cannot see it work otherwise.)
Sounds to me you have a very weird setup, and as you keep adding more details: anything else you haven’t told us yet?
(Oh, seeing that the node’s uplink says the counter is 7941, it seems resetting the node does not reset the counter, or you’re sending an awful lot. What does the hourly reset do then?)
The resetting of node is for hardware working as watchdog so that it doesn’t hang over time and not for TTN counter.
I have disabled the ADR to set the SF to lower value and testing it with SF9.
I am sending the data every 10 sec in this scenario with SF9 just for testing purpose.
I’m with kersing here: I’d check the keys, even though you said all worked fine earlier. (Meanwhile you’ve surely uploaded new software into your device. Check, double-check the keys!)
Which handler and router are you using? Do you have any integrations enabled? Maybe it’s just TTN Console that’s not showing the current counter and data; I’d try the MQTT API, which might also show errors.
Yes, everything worked earlier. Yes, I just registered a new device on TTN and uploaded the firmware with those keys with SF9 for testing.
I am using EU handler.
Yes HTTP Integrations are enabled. The data is not showing on our integration as well.
well, you’re correct. i’m just getting started… but recently found that setting helped me in the exact same situation.
i’m currently using hottimuc TTNMapper and it seems as if the node does start fresh at 0 after each reboot.
does there exist a log of some sort, where we can check what happens between gateway traffic and apllication data? “why does the message not make it to the application?”
Unfortunately, there is almost no log, neither in TTN Console, nor when subscribing to the MQTT error events topic.
If the MIC fails, then TTN won’t know which device the failure belongs to, as it needs the MIC to find the device. So then it simply cannot log anything. For replay attacks (which, in terms of security, really is what re-using a lower frame counter is about) TTN does know which device it’s rejecting the frame counter for, but unfortunately does not log that either.
Sure, for testing it might help. It might even help for debugging, though like mentioned in the warnings I already linked to above, just changing any setting of an ABP device will also reset the downlink counter, which for a production device can be really troublesome. In this very case, the uplink counter in the first screenshot was at 7941, which does not seem to indicate the device was recently reset.
Hello,
I have the same problem: ttn console shows uplink traffic in gateway, but no data in application nor in End device.
I use ABP (my gateway build with TTGO-LORA ESP32 and single channel LoRaWAN gateway)
I controlled received packet with LoRaWAN 1.0.x packet decoder and MIC is correct).
SCPF’s/DCPF’s are not supported on the Forum(*) and cause problems to users - both own and others - as you are likely finding! Please disconnect it from TTN immediately.
Get yourself a LoRaWAN GW and tray again and come back if you still have problems. *Use Forum search if you want to know why…