ST P-Nucleo-LRWAN2 stopped working

I have an ST P-Nucleo-LRWAN2 kit: P-NUCLEO-LRWAN2 - STM32 Nucleo pack LoRa™ HF band sensor and gateway - STMicroelectronics

I followed their instructions (User Manual UM2587), and it was all working on Tuesday (19th).

The Gateway uses the ‘legacy Semtech packet forwarder’.

I could see traffic in the Gateway console view, and in the Device console view:

image

On the I-Nucleo-LRWAN1 device, the green LED blinks each time it transmits - I could see that a new payload appeared in the Device console view corresponding to each blink.

Some time in the latter part of Wednesday (20th), I noted that the LED had stopped blinking.

On Thursday (21st), looking at the Console, I saw that the Gateway status was ‘Not Connected’, and there was no data in the Device view.
I tried restarting the Gateway (AT+RESET), but that made no difference.

I found forum posts saying that ‘Not Connected’ could simply mean that there’s no data going through the Gateway.

So I power-cycled the Device.
This did start the LED blinking again, but the Console views showed only Join requests - no actual data messages.

(screenshot uploads seem to be broken now)

The Gateway did seem to be sending Join accepts, but the device never seemed to see them - it just carried on sending requests.

Another forum post mentioned that the device message counters might be out-of-sync - so I did a ‘Reset Frame Counters’ on the Device Overview console page.
This made no difference.

A different device (WizziLab SH2050 shield, in LoRaWAN mode) was able to join & send data OK.

So I left the ST kit for a while - and it just started working again later in the day (Thursday).

This morning (Friday, 22nd), I see that the ST device has stopped blinking again!
(the WizziLab is still working).

The ST device is as-received - no configuration changes or firmware updates.
As supplied, it transmits every ~ 40s.

Is this too much? Is TTN “blacklisting” it, or something?

I’ll be posting on the ST forum, too.

I guess the main question here is, what is the best way to diagnose this stuff on TTN?

The trouble with the Console traffic views is that they seem to keep only a little history while the page is open, and that is all lost when you navigate away from the page.

Is there a way to get long-term logs?

In fact, the whole forum seems a bit flaky at the moment - it’s taken several attempts to get this posted!

In the absence of my own screenshots, the screenshots in this post appear the same:

See update from this morning - I too saw some short term trouble posting info/pictures, but appears (largely?!) resolved now - but there may be further interupts as update completes and beds in

https://www.thethingsnetwork.org/forum/t/discourse-update/43125

Thanks.

image

At one point I was getting an “under maintenance”, but it just referred me to https://status.thethings.network/ - which doesn’t mention the forum.

Also got:

2021-01-22 (5)

The above-mentioned post links to:

One thing noted there is to keep the Device >8 feet from the gateway.
Mine was under 1 foot, but moving it >12 feet away has made no difference:

(screenshot upload failed again)

There is a blue LED on the Gateway which blinks shortly after each blink of the ST Device LED (also after sending from the WizziLab device).
I haven’t seen a description of exactly what this indicates, but it seems to show that the Gateway at least thinks it has sent a reply?

My bad I linked a Staff & Mods update thread which is locked from general users, sorry! But you get the message that Forum SW is upder upgrade process any how :wink: Back to normal soon if not already! :slight_smile:

1 Like

Here:

with some more screenshots!

A long thread by @hraftery on what seems to be a similar issue (though different equipment):

and, as he says, there do seem to be a lot of threads with the same issue - but no solutions.

He notes that the Join Accept is being transmitted on a different frequency to the Join Request - which is also the case for me:


It seems that the Accept is always sent on 869.525 - but the Request is sent on various frequencies

I also note his comments on how hard it is to collect this data - screenshots of 5 Request/Accepts per page, and a history of only about a dozen pages.
Is there really no way to download these logs in bulk?
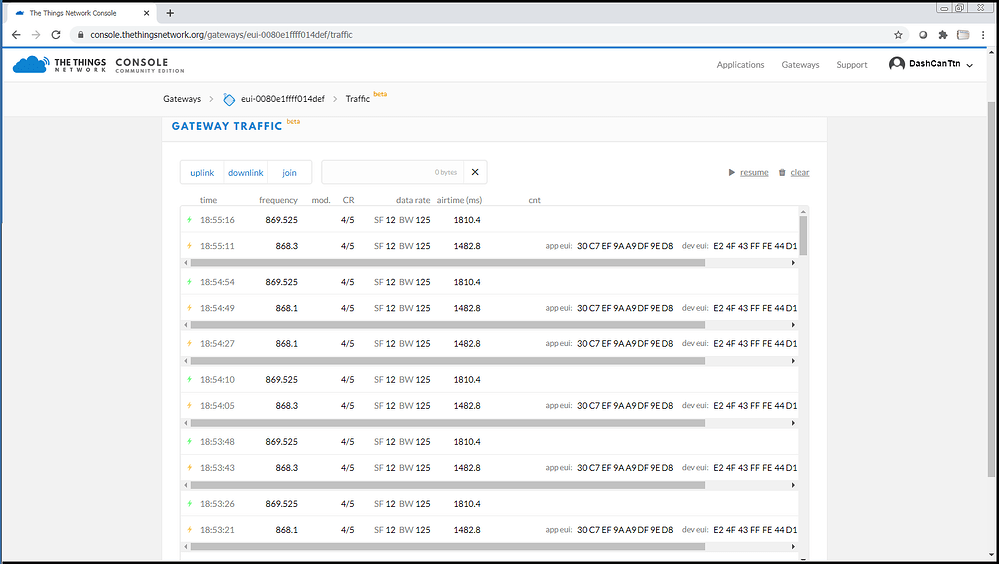
Yes, it’s being sent in the EU868 join RX2 window, which uses fixed settings.

That might hint at your problem though: TTN normally uses non-standard RX2 settings of SF9BW125, but for join RX2 still needs standard SF12BW125.

It’s possible that if your node has been configured for TTN, it’s mistakenly listening during join RX2 at SF9 rather than SF12, by confusing what it would be told in the join accept to do for ordinary (not join) RX2.

OK - thanks.

But, then, how has it managed to join a couple of times - did it just happen to “get lucky”?

This is all ST stuff - I’ll have to check their docs again to see if there’s something buried that I’ve missed…

EDIT

I guess the fact that the WizziLab devices work fine suggests that the problem lies in the ST I-Nucleo device - not the gateway.