Hello, I did some forum search and understood that the gateway was too close to node, so I moved them a bit and now this is the new Logread RxTXJson of the gateway
{"stat":{"time":"2023-07-11 07:59:33 UTC","rxnb":3,"rxok":3,"rxfw":3,"ackr":0.0,"dwnb":0,"txnb":0}}

{"rxpk":[{"tmst":2011132180,"time":"2023-07-11T07:59:39.386365Z","chan":1,"rfch":0,"freq":865.402500,"stat":1,"modu":"LORA","datr":"SF12BW125","codr":"4/5","lsnr":9.0,"rssi":-97,"size":23,"data":"ABERERERERERDlcH/v8JH6zAC8Gc5dc="}]}

{"rxpk":[{"tmst":2021138292,"time":"2023-07-11T07:59:49.389308Z","chan":0,"rfch":0,"freq":865.062500,"stat":1,"modu":"LORA","datr":"SF12BW125","codr":"4/5","lsnr":9.0,"rssi":-94,"size":23,"data":"ABERERERERERDlcH/v8JH6xdIqbNBbk="}]}

{"rxpk":[{"tmst":2031144396,"time":"2023-07-11T07:59:59.402519Z","chan":0,"rfch":0,"freq":865.062500,"stat":1,"modu":"LORA","datr":"SF12BW125","codr":"4/5","lsnr":8.5,"rssi":-99,"size":23,"data":"ABERERERERERDlcH/v8JH6yFu+1nLvU="}]}

{"stat":{"time":"2023-07-11 08:00:03 UTC","rxnb":4,"rxok":3,"rxfw":3,"ackr":0.0,"dwnb":0,"txnb":0}}

{"rxpk":[{"tmst":2041150500,"time":"2023-07-11T08:00:09.406225Z","chan":0,"rfch":0,"freq":865.062500,"stat":1,"modu":"LORA","datr":"SF12BW125","codr":"4/5","lsnr":9.5,"rssi":-97,"size":23,"data":"ABERERERERERDlcH/v8JH6xLFNF20fg="}]}
and the Logread report is
################## Report at: 2023-07-11 07:59:33 UTC ##################

### [UPSTREAM] ###

# RF packets received by concentrator: 3

# CRC_OK: 100.00%, CRC_FAIL: 0.00%, NO_CRC: 0.00%

# RF packets forwarded: 3 (69 bytes)

# PUSH_DATA datagrams sent: 3 (732 bytes)

# PUSH_DATA acknowledged: 0.00%

### [DOWNSTREAM] ###

# PULL_DATA sent: 1 (100.00% acknowledged)

# PULL_RESP(onse) datagrams received: 0 (0 bytes)

# RF packets sent to concentrator: 0 (0 bytes)

# TX errors: 0

# BEACON queued: 0

# BEACON sent so far: 0

# BEACON rejected: 0

### [PPS] ###

# SX1301 time (PPS): 1983469783

################## Report at: 2023-07-11 08:00:03 UTC ##################

### [UPSTREAM] ###

# RF packets received by concentrator: 4

# CRC_OK: 75.00%, CRC_FAIL: 25.00%, NO_CRC: 0.00%

# RF packets forwarded: 3 (69 bytes)

# PUSH_DATA datagrams sent: 3 (732 bytes)

# PUSH_DATA acknowledged: 0.00%

### [DOWNSTREAM] ###

# PULL_DATA sent: 1 (100.00% acknowledged)

# PULL_RESP(onse) datagrams received: 0 (0 bytes)

# RF packets sent to concentrator: 0 (0 bytes)

# TX errors: 0

# BEACON queued: 0

# BEACON sent so far: 0

# BEACON rejected: 0

### [PPS] ###

# SX1301 time (PPS): 1983469783
Is 25% failed CRC too much?
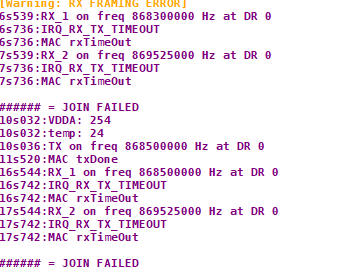
The YAT terminal is same as before
100s093:VDDA: 254
100s093:temp: 23
100s097:TX on freq 865402500 Hz at DR 0
101s582:MAC txDone
106s606:RX_1 on freq 865402500 Hz at DR 0
106s803:IRQ_RX_TX_TIMEOUT
106s803:MAC rxTimeOut
107s569:RX_2 on freq 866550000 Hz at DR 2
107s635:IRQ_RX_TX_TIMEOUT
107s635:MAC rxTimeOut

###### = JOIN FAILED
110s100:VDDA: 254
110s100:temp: 23
110s104:TX on freq 865402500 Hz at DR 0
111s588:MAC txDone
116s613:RX_1 on freq 865402500 Hz at DR 0
116s810:IRQ_RX_TX_TIMEOUT
116s810:MAC rxTimeOut
117s576:RX_2 on freq 866550000 Hz at DR 2
117s642:IRQ_RX_TX_TIMEOUT
117s642:MAC rxTimeOut

###### = JOIN FAILED
And I could not find any detailed discussion or documentation about CRC failure of LoRa, where I can find some? Thank You.