A bit of logging from my single channel gateway, for a successful OTAA:
A 18:23:18.659167	pull	01946a025ccf7ff42f1970ec
B 18:23:22.555010	rxpk	01bf72005ccf7ff42f1970ec	message	{"rxpk":[{"rssi":-46,"stat":1,"modu":"LORA","rfch":0,"tmst":349218460,"datr":"SF7BW125","lsnr":9,"time":"2017-01-26T18:23:22.510034Z","codr":"4/5","data":"ANwAANB+1bNwHm/t9XzurwDIhgMK8sk=","freq":868.100,"chan":0,"size":23}]}	length	237
C 18:23:23.658268	pull	01af68025ccf7ff42f1970ec
D 18:23:27.372908	txpk	{"txpk":{"imme":false,"tmst":354218460,"freq":868.1,"rfch":0,"powe":14,"modu":"LORA","datr":"SF7BW125","codr":"4/5","ipol":true,"size":33,"data":"IIE/R/UI/6JnC24j4B+EueJdnEEV8C7qCz3T4gs+ypLa"}}
E 18:23:27.389906	txpk_ack	{"txpk_ack":{"error":"NONE"}}
F 18:23:27.508022	transmitPkt	9886	6300	-1	868100000	112	112	2	64	14	33
Above, line B is the Join Request (with the gateway’s timestamp being 349218460). TTN Console shows that at 19:23:22; it seems to know my local time zone.
Line D is the Join Accept which seems to arrive at the gateway after 4.818 seconds. The timestamp in the Accept, indicating when to forward it to the node, is set to be 354218460, hence 5,000,000 microseconds or 5 seconds after the timestamp from the Join Request. (All relative to the gateway’s timestamp, like Kersing explained above.) So, TTN wants the gateway to send it in RX1, following JOIN_ACCEPT_DELAY1. Indeed, in line F it’s transmitted.
Before truly transmitting it in line F, in line E an acknowledgement is already sent back to TTN. Jaap’s single channel gateway will report TOO_LATE if the downlink came too late (following Semtech’s Gateway to Server Interface Definition):
local msg='{"txpk_ack":{"error":"NONE"}}'
if trig <= 0 then
  msg='{"txpk_ack":{"error":"TOO_LATE"}}'
end
So, the size of the acknowledgement might give you an indication if the gateway thinks all is fine? When sent without whitespace, the NONE is 29 bytes, the TOO_LATE is 33 bytes.
As LMiC starts OTAA whenever the first packet is to be sent, a successful Join is followed by the first data:
G 18:23:27.684300 rxpk 01ee4d005ccf7ff42f1970ec message {"rxpk":[{"rssi":-48,"stat":1,"modu":"LORA","rfch":0,"tmst":354347381,"datr":"SF7BW125","lsnr":9,"time":"2017-01-26T18:23:27.639420Z","codr":"4/5","data":"QCkuASaAAAAByFaF53Iu+vzmwQ==","freq":868.100,"chan":0,"size":19}]} length 233
(As an aside: this way, the first data received after a Join, will always be a bit late, unless one explicitly first forces a Join when starting the device.)
After the OTAA, the gateway goes into pulling commands from TTN, and sending statistics:
H 18:23:28.657846	pull	017601025ccf7ff42f1970ec
I 18:23:33.657938	pull	015754025ccf7ff42f1970ec
J 18:23:38.631359	stat	01e961005ccf7ff42f1970ec	message	{"stat":{"rxfw":2,"alti":3,"lati":52.123456,"rxok":2,"long":4.987654,"time":"2017-01-26 18:23:38 GMT","txnb":1,"dwnb":2,"rxnb":2,"ackr":100.0}}	length	155
K 18:23:38.659612	pull	01b3d0025ccf7ff42f1970ec
Every now and then my node will ask for a link check in an uplink. (Even though TTN does not support ADR yet, my test node has link check enabled.)
L 19:02:53.661983	pull	015e66025ccf7ff42f1970ec
M 19:02:54.474860	rxpk	01450f005ccf7ff42f1970ec	message	{"rxpk":[{"rssi":-54,"stat":1,"modu":"LORA","rfch":0,"tmst":573653463,"datr":"SF10BW125","lsnr":12,"time":"2017-01-26T19:02:54.429481Z","codr":"4/5","data":"QCkuASbAMwABMngK0sWEN3AgBQ==","freq":868.100,"chan":0,"size":19}]}	length	235
N 19:02:56.191305	txpk	{"txpk":{"imme":false,"tmst":575653463,"freq":869.525,"rfch":0,"powe":27,"modu":"LORA","datr":"SF9BW125","codr":"4/5","ipol":true,"size":12,"data":"YCkuASYgAwDQNni9"}}
O 19:02:56.206041	txpk_ack	{"txpk_ack":{"error":"NONE"}}
P 19:02:56.426678	transmitPkt	10332	7063	0	869525000	144	112	2	64	27	12
Q 19:02:58.661714	pull	013877025ccf7ff42f1970ec
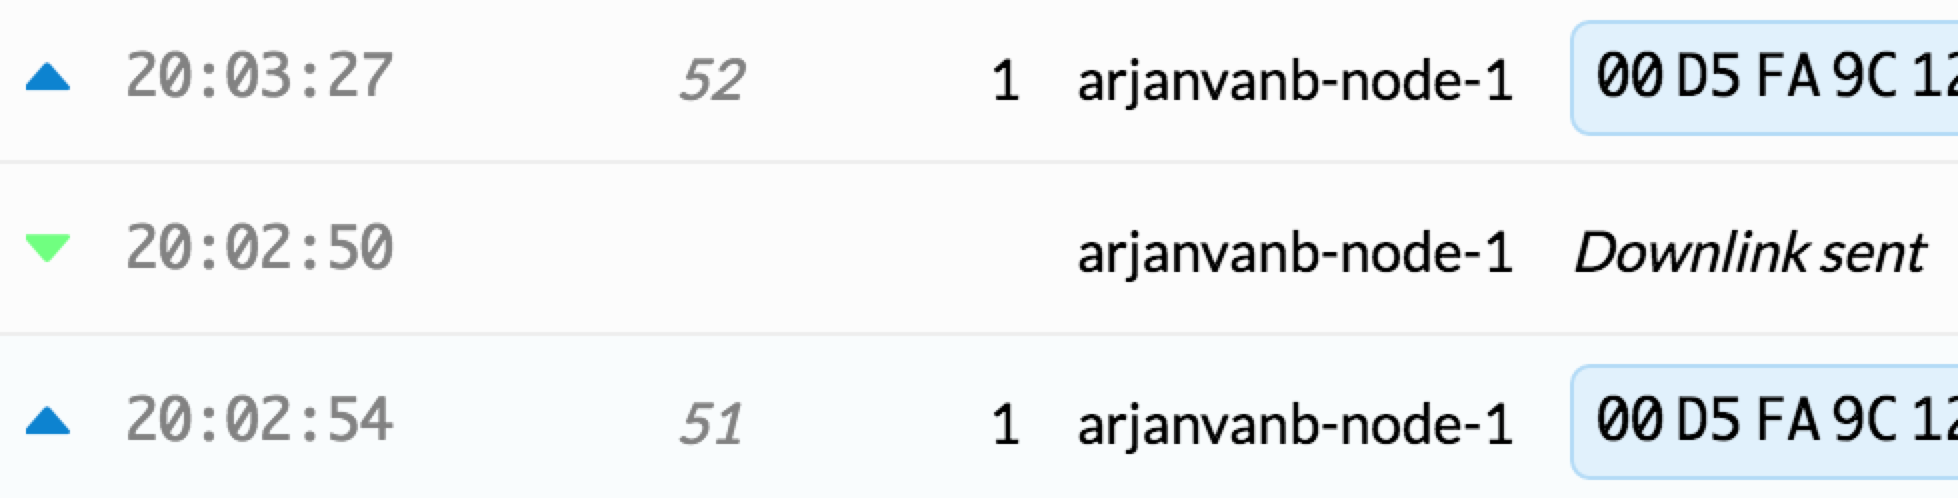
In line M the timestamp in the uplink is 573653463. In the downlink in line N, which is received after 1.716 seconds, it’s 575653463, hence 2 seconds difference. Again, the downlink is received just in time to forward it to the node. For this, TTN Console seems to have the seconds wrong in 20:02:50, and they are not in line with the uplink that preceded the downlink:
If your gateway does not print timestamps, then the following (or alternatives) might help to add a timestamp when monitoring a file called logfile:
tail -f logfile 2>&1 | while read l; do d=`date +%H:%M:%S.%N`; echo $d $l; done