I don’t think its related to the gateway. If I keep repeating mac join otaa , I eventually get a accepted". Lukas
@lukas How many times did you repeat this? This morning I had the same issue again. Tried to join for 6 times, all times denied. When I restarted the gateway software (sudo systemctl restart ttn-gateway.service), the first attempt is accepted directly.
Any help is welcome 
PS. Did not had time to test if ABP activated nodes able to send data at that same moment… Will try that next time.
I can’t tell right now. I have 2 cronjobs now, one restarts the gateway every hour, one that reinstalls the latest gateway software every night. Brute force, baby.
The last coupe of days, OTA with my Moteino works now very fast, it gets a session immediately. I am not sure how long the keys are up though.
ABP isn’t really working for me: once I disconnect my node from power, I have to regenerate the personalized device/keys. Maybe thats how it should be though.
But since we’re in beta still, its quite difficult to figure out whats right and wrong 
Yes, very much by design:
[…] you should realize that these frame counters reset to
0every time the device restarts (when you flash the firmware or when you unplug it). As a result, The Things Network will block all messages from the device until theFCntUpbecomes higher than the previousFCntUp. Therefore, you should re-register your device in the backend every time you reset it.
So, when using ABP for production, you should save the counters in non-volatile memory. For insecure debugging, one can disable the check.
Hi guys,
I am having the same problem with OTAA procedure! At the startup of both gateway and end-node the OTAA works and the connection is established. As soon as I unplug the end-node from power, and I plug it back again to start a new session, I can’t activate the device any longer, unless a reboot of the gateway is performed!
ABP works just fine instead, with no need to reboot the gateway each time.
My end-node consists of an arduino+dragino shield, and I am using a Kerlink Station as gateway. The arduino’s sketch that I am currently using is the “ttn-otaa.ino” example provided by the LMIC library.
Am I missing something in the gateway/node configuration? Is really that the way it is supposed to work?
Any help is greatly welcome!
Regards,
Salvatore.
In Over-the-air-activation OTAA with LMIC, @matthijs suggested for LMiC nodes:
Perhaps your clock is inaccurate, but the error is negligable at the slower SF ratings? To check, add this to your sketch (somewhere during setup):
LMIC_setClockError(MAX_CLOCK_ERROR * 1 / 100);</pre>
This tells LMIC to make the receive windows bigger, in case your clock is 1% faster or slower.
I know that @salvatore_forte already tried that, but it made me wonder about timing issues.
As rebooting the gateway works for both a Kerlink Wirnet Station and an ic880A/Raspberry Pi 3:
-
Another post from @salvatore_forte shows that TTN actually accepted the Join Request, but the node probably never received the downlink. After accepting the Join, TTN will tell one gateway to send the Join Accept in either downlink slot 1 or 2. (I don’t know if the gateway received it*.) Does a gateway keep track of the downlink timing itself, or does TTN give the gateway an exact timestamp at which the downlink must be sent? For the latter, I can understand that restarting might fix things:
- If the gateway’s clock is off, it might get synced with some time server at boot time.
- If the gateway time and the TTN’s backend time need to be synced, then restarting might fix that too?
-
Could the gateway’s timing become inaccurate after running for some time? If it would, then I don’t understand how a simple reset of the gateway fixes that (like: the gateway won’t cool down in such a short time), but maybe someone can think of a reason.
*) @salvatore_forte, can you check if the gateway receives the downlink from TTN? If you cannot check that, then: if you know that OTAA fails after, say, 3 hours, then what if you restart the gateway, wait for 3 hours and only then do the first OTAA?
For debugging it might also be useful to test if regular downlinks still work after some time?
Hi @arjanvanb,
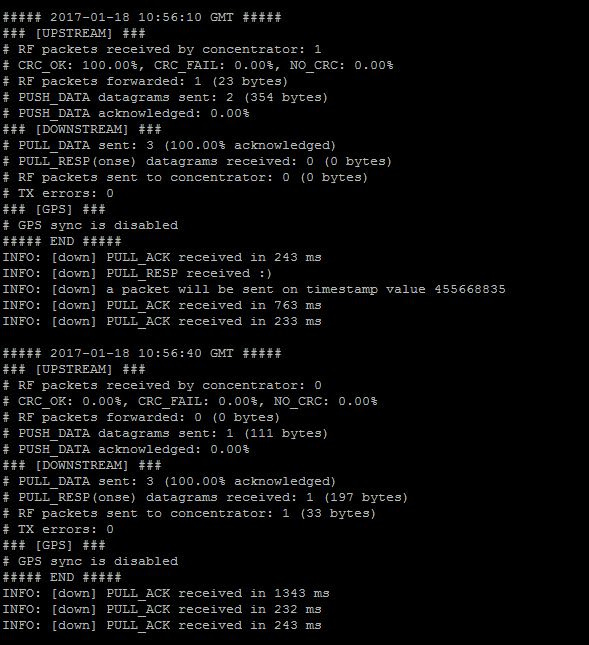
first of all, many thanks for the help! I made the test that you also suggested, checking if the response packet from the TTN server gets back to the gateway. The answer is yes! Here you can find the response that I get after manually launching the poly_pkt_fwd in the SSH client prompt:

As you can see, the network server scheduled a response to my join, which was successfully sent back to the concentrator, since TX error field is equal to 0.
TTN provides the timestamp based on the timestamp in the original join request. That timestamp is not related to wall clock time so in a window of a few seconds it time synchronisation should not be an issue.
If the issues start occurring after the gateway has been running for a few hours my first suspicion is firewall issues. When the gateway is restarted the connections are fresh and the firewall will forward the packets to the gateway, after a few hours ‘connection’ time-outs will have kicked in and packets may be lost.
To debug: install tcpdump on the RPi and wait for the moment the join fails. At that point in time start tcpdump and check for traffic on port 1700. You should see both a packet to TTN and a few seconds (about 4-5) later a packet from TTN.
Hi @kersing,
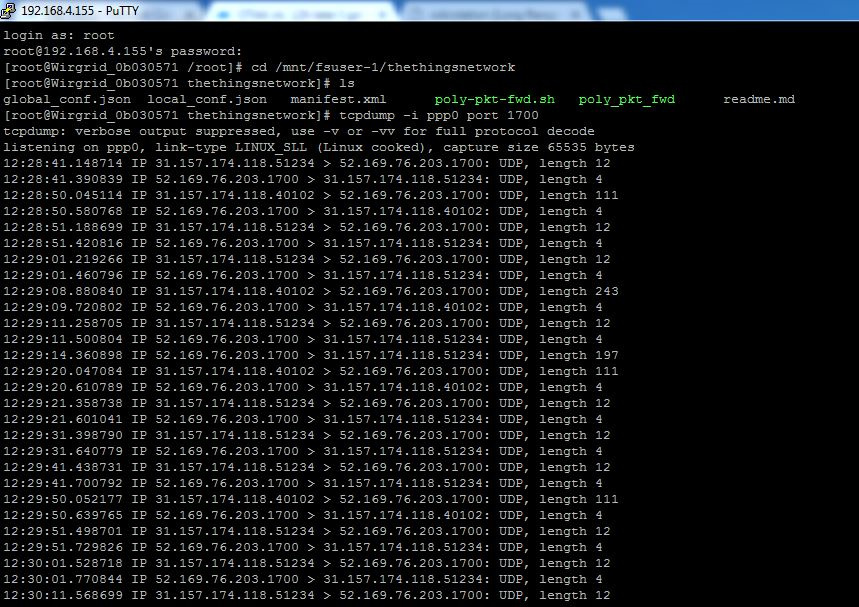
if I run a tcpdump on port 1700 in the event of a join fail I can see packets sent by the gateway to the network server, and as response, back to the gateway. See the screenshot below:

OTAA works fine only when a reboot of the gateway is performed, indipendently from how long it has been up and running before.
Can you give an indication about how long it takes before the problem shows? And can two devices do a successful OTAA before the gateway needs a restart?
So far we know it’s not a firewall issue as the Join Accepts are received by the gateway. And the problem occurs on at least two different type of gateways. Just some more shots in the dark:
What would account for the difference between receiving 197 downstream bytes and only forwarding 33 bytes to the concentrator? (It seems a join-accept message from gateway to node is 28 bytes, so 33 bytes towards the concentrator might suffice.)
As for those 33 bytes that got forwarded:
-
Would anyone know if a downlink gets passed to the concentrator at the specific timestamp of the receive window, or would it be forwarded to the concentrator as soon as the gateway receives it, and is it up to the concentrator to determine when exactly to broadcast it? (I assume the latter…)
-
If the concentrator needs to decide: is the timestamp that is sent to TTN also set by the concentrator? (If the timestamp in the uplink has a different source, like if it is set by the gateway, then drift in the timers of gateway and its concentrator might be the culprit?)
And for further debugging:
The screenshot that shows that 33 bytes got forwarded to the concentrator, shows the 30 seconds statistics. For EU863, receive window JOIN_ACCEPT_DELAY1 is 5 seconds, JOIN_ACCEPT_DELAY2 is 6 seconds. Matching realtime logs might help debugging.
And how long was the gateway running for the above screenshot? I wonder what the timestamp 455668835 means.
(Please, next time post text rather than screenshots? Just indent with 4 spaces to get scrollbars for long lines.)
With software version based on the semtech forwarder below 3.0 the data is send to the concentrator as soon as it is received. If another packet is received during the interval between receiving the first and transmitting it the data from the first packet will be lost. Poly_pkt_fwd is based on the below 3.0 versions for most platforms. (I know there is a newer version for Lorank8)
Looking at the tcpdump log this should not be an issue here.
The timestamp in the packet to TTN is set by the concentrator. TTN adds a fixed amount to it (depending on the window to be used) and includes the result in the transmit packet.
I am assuming this trace is for a failed join attempt. Looking at it there is a packet to TTN at 12:29:08.880840, probably a join request. At 12:29:14.360898 data is received from TTN, probably the join response. As the time between the two packets is > 5 seconds this packet must be for the RX2 window (which is at 6 seconds).
Could you create a new trace with a successful join so we can compare the data? If possible use ‘-X’ so we can see both tcp header and data. (A trace with -X for a failed attempt would be good as well.)
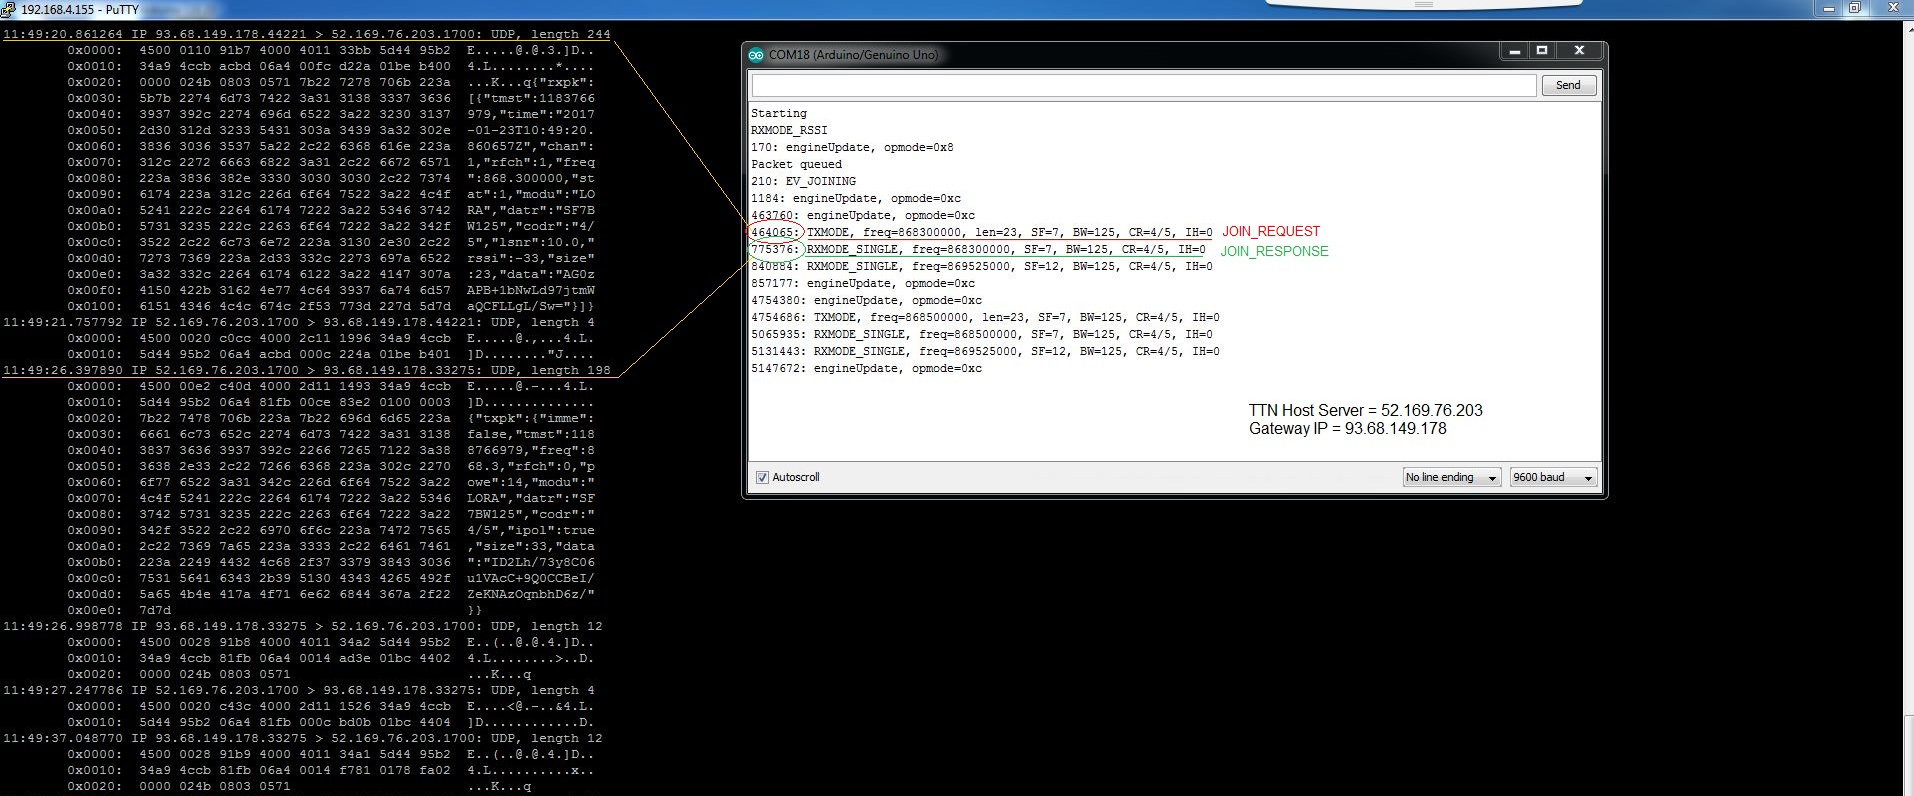
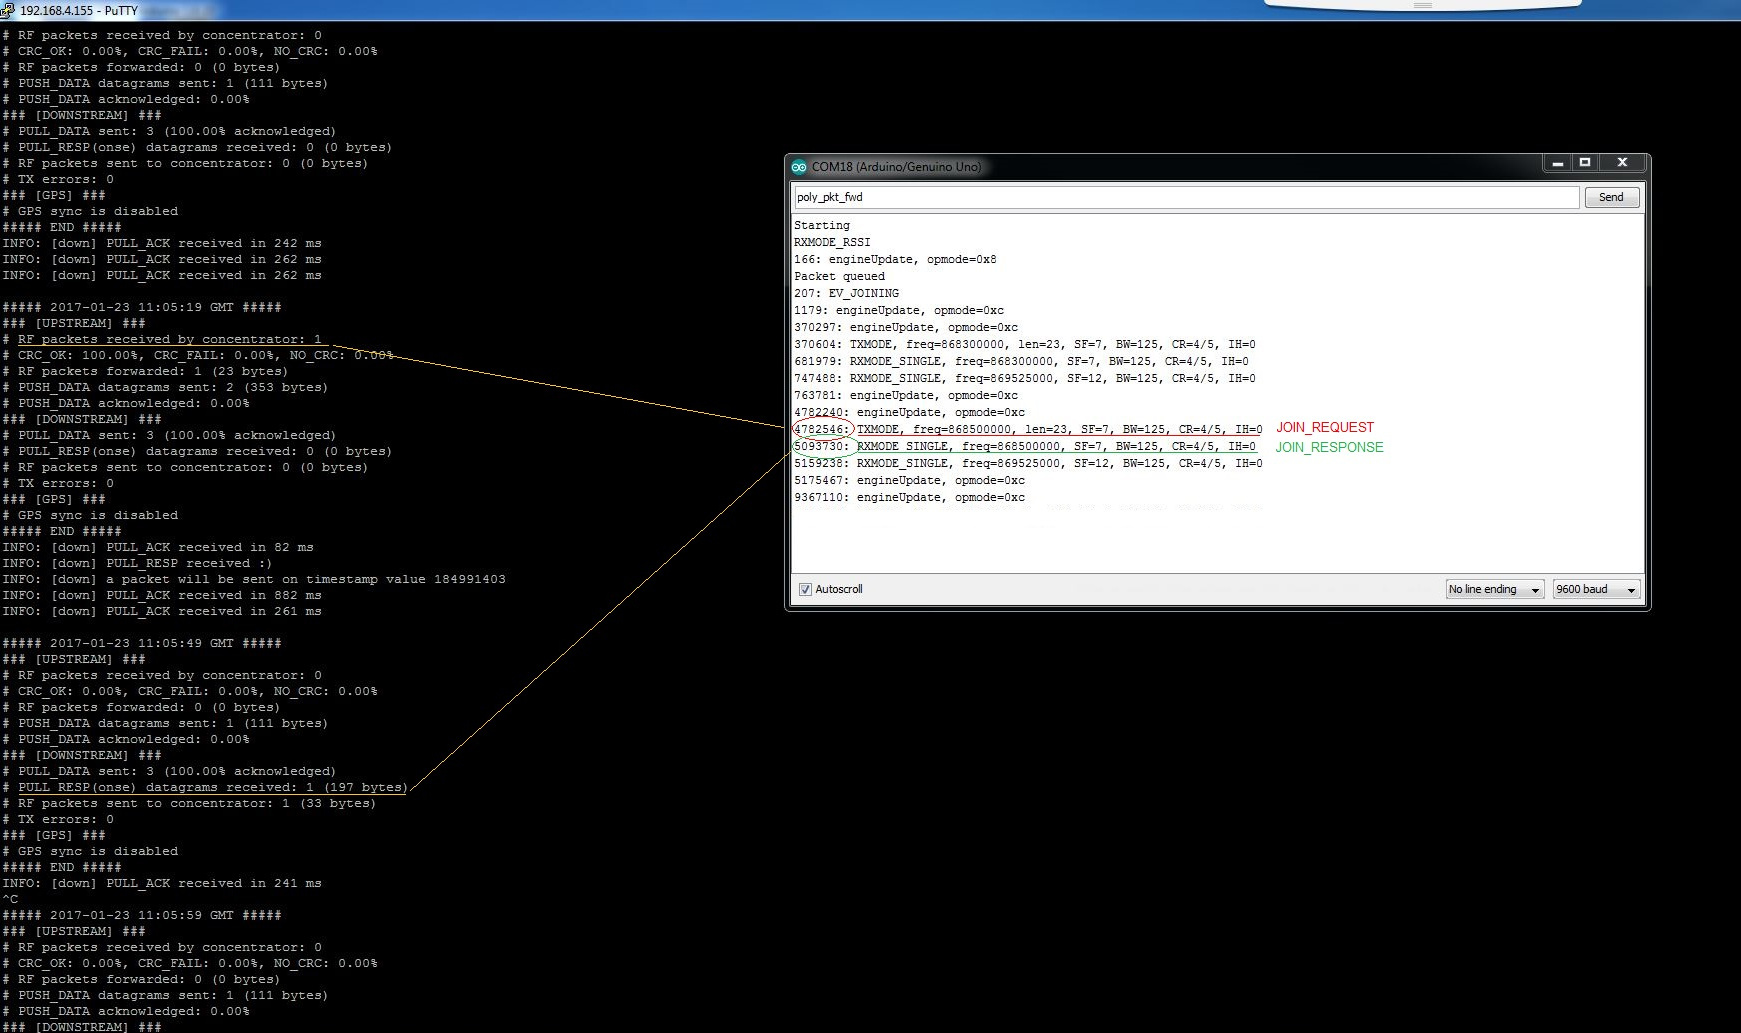
sorry for the late reply, I didn’t have the gateway with me to make a new trial. Anyway, this morning I couldn’t get accepted on TTN using OTAA activation procedure. However, I would like to share few considerations about the results that I have got so far running both the poly_pkt_fwd and the tcpdump command.
"tcpdump -i ppp0 port 1700 -X"

"./poly_pkt_fwd"

The join_request is correctly sent to the webserver, and consequently the join_accept message is received from the gateway, so we can definitely exclude missing communication between gateway and server. Furthermore, looking at the first picture, you can also see that the RF packets is scheduled to be sent on a specific timestamp (still not sure who is defining it). I guess the problem stands in the last part of the communication chain, so the Arduino in somehow is not receiving the join_accept sent on Lora side from the gateway (for windows slots synchronization?)
To further confirm this result, I have also noted that using the other activation procedure (ABP) I can correctly sent packets from my Arduino node to the TTN backend server (they are shown in the TTN console), but I can’t get back message the other way around as seen with OTAA (I simply tried to send few packets from TTN device view within the console but I couldn’t see the packets back in the serial monitor, even though the downlink packets was successfully sent to the gateway).
Thank you for posting the information for a successful attempt. Can you post the same for an unsuccessful attempt? I agree there is no communication issue from the gateway to the server. I fear there might be an issue from the server to the gateway.
Being able to send data to TTN but not from TTN to the node confirms the issues you are having with OTAA. Using ABP and sending data does not require communications from TTN to the gateway. Both sending data to the node and OTAA requires data from TTN to the gateway. And the data needs to be available within a small time window, any network delays can result in the data being delivered to the gateway too late.
I might have a debug build of the packet forwarder for Kerlink available, however running that build requires copying files to the kerlink and moving them in the right location. Would you be able (and willing) to try it?
Hi @kersing,
I have also wrote to @matthijs to see if he has ever experienced anything like this running the “ttn-abp.ino” example sketch. It looks strange that I can successfully upload packets on TTN but I can’t get anything back from the server. If you think it’s useful, I can definitely try to use your debug build, but first I would wait for @matthijs response…maybe I am missing something on the Arduino side and a fix of code is needed.
Making a tcpdump trace of an unsuccessful join attempt can provide some insight into possible timing issues. If that is not too difficult I would suggest to proceed on that anyway.
And also, I still wonder if “regular” downlinks work at the time where (you expect) OTAA does not work.
By the way, if the following are indeed the Join Request and Accept, I find 5.5 seconds quite a long time to respond. Especially as I assume the backend servers are not really busy yet, and even more so as it’s just half a second before JOIN_ACCEPT_DELAY2:
(For a regular downlink, for EU863 the default RECEIVE_DELAY1 is 1 second, and RECEIVE_DELAY2 2 seconds. Maybe TTN configures different values?)
The response for RX2 will be sent to the gateway between 5 and 6 seconds after the join request. However in my experience the response arrives just after the 5 second mark, not half a second into the window. Any additional delay is probably due to network lag. This is assuming the response is for RX2 and not a delayed RX1 packet…
(All downlink packets, join response and data, will be offered to the gateway within 1 second of it being due to be transmitted)
Hi @kersing,
maybe I was not that clear in the last post, the two pictures above are referred to an unsuccessful join attempt! Since I found out that I can’t get any downlink packet from web server, even when I use the ABP activation, I start to believe that the problem is the timestamp at which the RF packet delivery is scheduled. Who is defining it? Could be that there is a mismatch and that’s the reason why packets get lost?