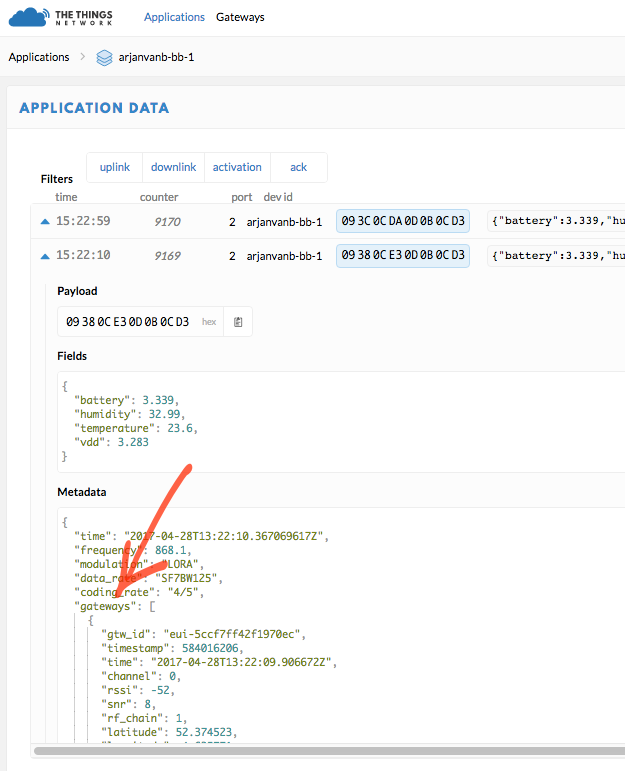
Click on an uplink in the application’s or device’s Data page. You’ll see details for all gateways that received that uplink. Remember: that could be multiple gateways. (I don’t know how the list of gateways is sorted in that case.) The gateway’s Traffic page will show the same details when clicking an uplink, but only for that specific gateway.
Be sure to have the TTN Console browser window open when receiving data. (The details won’t show for historical data.)
To get the details in some programming code, you’d need the MQTT data API.
TTN Console application Data page example
MQTT example
{
   "app_id":"arjanvanb-app-1",
   "dev_id":"arjanvanb-bb-1",
   "hardware_serial":"70B3D5B020035CD1",
   "port":2,
   "counter":7165,
   "payload_raw":"CWUMqw0LDNM=",
   "metadata":{
      "time":"2017-04-27T10:07:27.207187339Z",
      "frequency":868.1,
      "modulation":"LORA",
      "data_rate":"SF7BW125",
      "coding_rate":"4/5",
      "gateways":[
         {
            "gtw_id":"eui-b827ebffff5fe05c",
            "timestamp":532315708,
            "time":"",
            "channel":0,
            "rssi":-57,
            "snr":9,
            "latitude":52.37447,
            "longitude":4.63576
         },
         {
            "gtw_id":"eui-5ccf7ff42f1970ec",
            "timestamp":1284851361,
            "time":"2017-04-27T10:07:26.494026Z",
            "channel":0,
            "rssi":-49,
            "snr":9,
            "rf_chain":1,
            "latitude":52.374523,
            "longitude":4.635771,
            "altitude":4
         }
      ]
   }
}