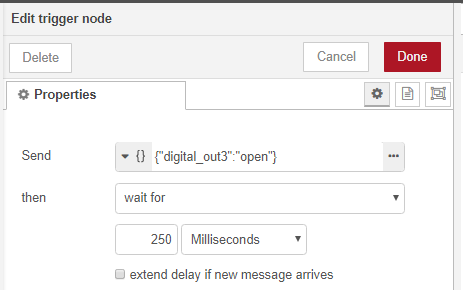
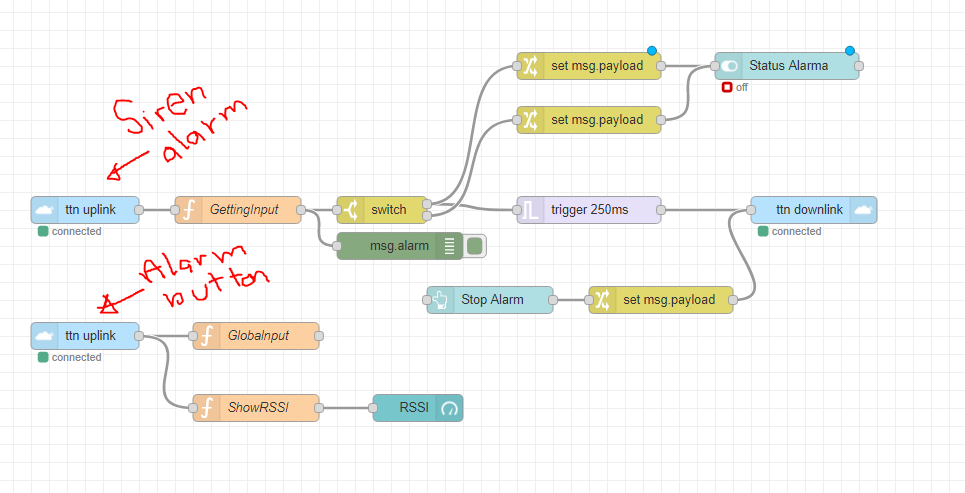
I have node-red installed, I cant get downlink when the events happens, In this case when the input == 0, it should send the JSON to the encoder. But nothing happens, If I use Inject module, it works without any problem.


I have node-red installed, I cant get downlink when the events happens, In this case when the input == 0, it should send the JSON to the encoder. But nothing happens, If I use Inject module, it works without any problem.


Why does the screenshot show all these blue dots? Those indicate that you’ve got unsaved changes. You’ll need to deploy those changes to make them active.
It seems to me that you only showed the path that works. However, to tell why the path from the ttn uplink up to the switch does not work like you expected, we’d need details about that path. Also, you’ll want to add many more msg nodes for debugging, activate those, and tell us what they show and what you expected, and for what payload of the uplink.
Aside: there’s no guarantee that you’ll be scheduling the downlink in time to be transmitted right after the uplink that triggers that very scheduling. Chances are that the scheduled downlink will be transmitted as a response to the next uplink. Also, beware of the maximum of 10 downlinks per day.
Hi Arjanvanb, the problem is that they were 2 different end nodes, we cant combine one ttn uplink of one node payload to activate the ttn downlink of the other link. This solved my problem:

I had to save the value of the panic button in one global variable then after use it to trigger the siren.
Best Regards
Jose
Assuming you’re using the TTN community network that only supports Class A devices: if the above implies that your “Siren” device is sending uplinks just to poll for a downlink command to control it, then I very much doubt that this is a suitable use case for LoRaWAN. Even less so on the TTN community network, which defines a fair access policy (with limitations that, I feel, should apply to any other low-density LoRaWAN network as well).
Also beware that there’s just no guarantee that your device’s uplinks are received; it’s radio in a shared spectrum after all.