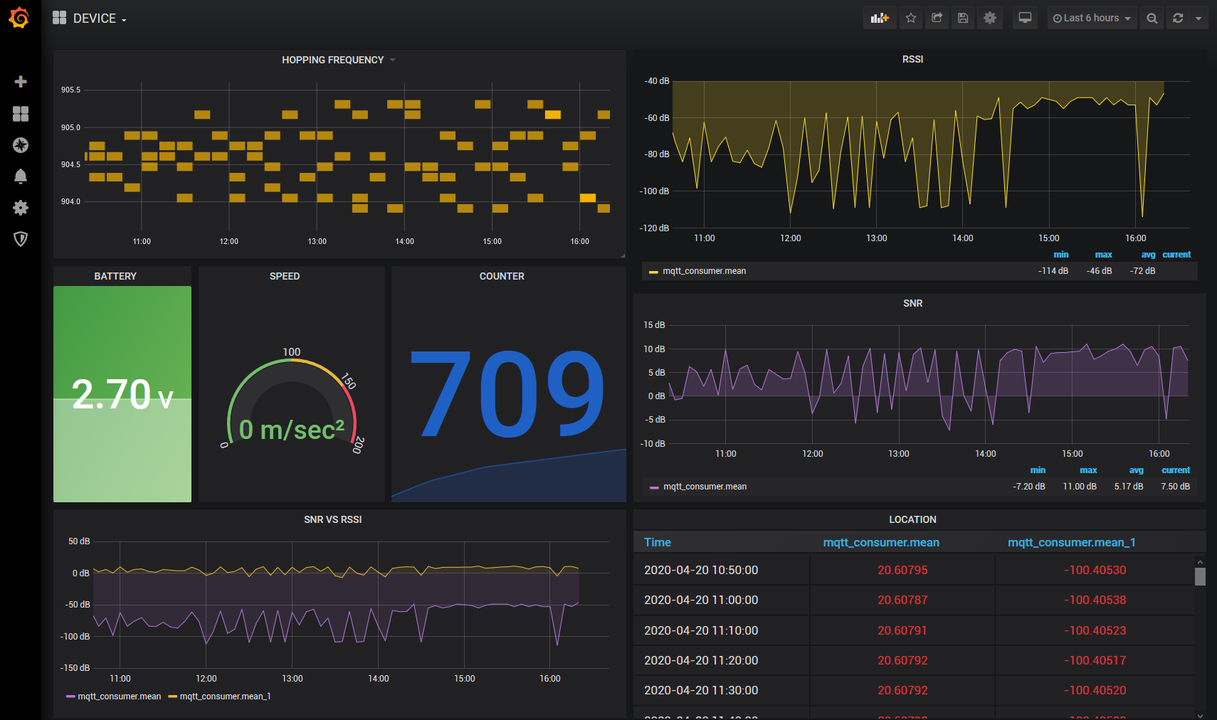
Creation of an IoT dashboard with Grafana + The Things Network + InfluxData.
Edit the telegraf.conf file and add the following section:
[[inputs.mqtt_consumer]]
servers = ["https://us-west.thethings.network:1883/"]
qos = 0
connection_timeout = "30s"
topics = [ "+/devices/+/up" ]
client_id = ""
username = “username"
password = “password"
data_format = "json"