On July 2023, the research team created beta version of the dashboard visualization of the project data collected from pilot locations.
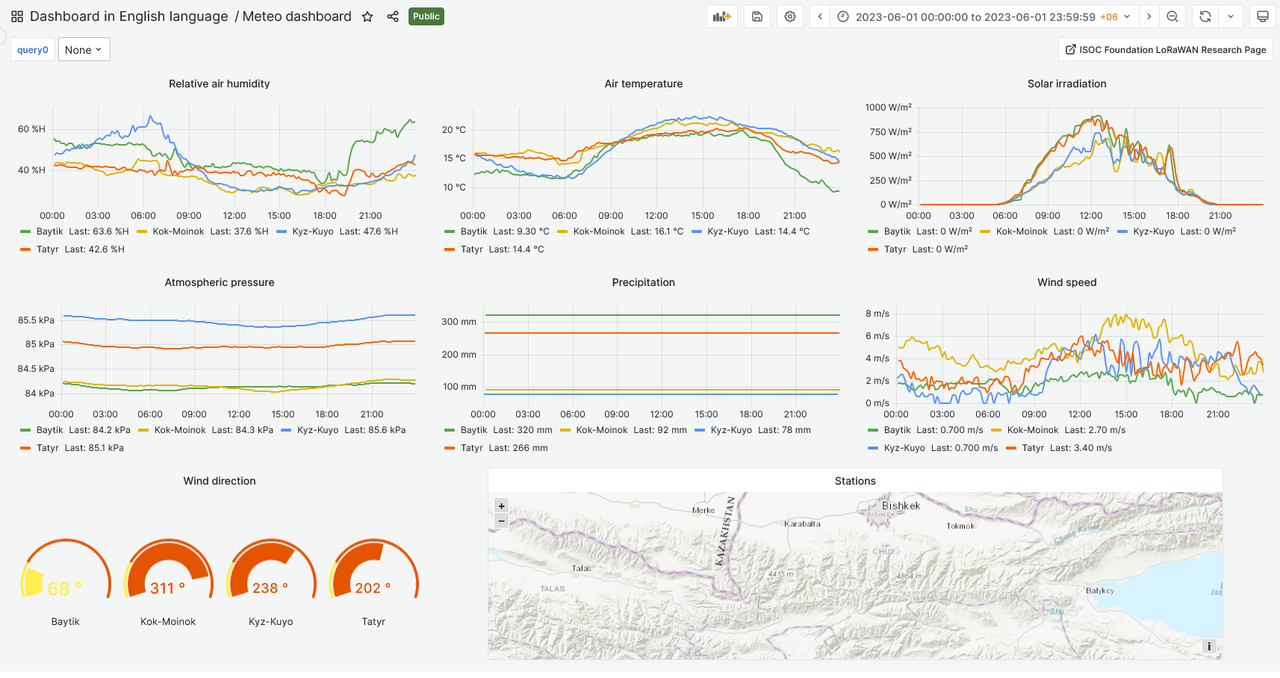
The dashboard represents visualization of the following data: relative air humidity, air temperature, solar irradiation, atmospheric pressure, precipitation, wind speed, wind direction. The other dashboard represents visualization of the following data: soil moisture and precipitation, water level. Dashboards are available in Kyrgyz, English and Russian languages. Some dashboards are specially designed for local communities to use for the benefit of community.
We believe in open source solutions. That’s why we use Grafana – a multi-platform open source analytics and interactive visualization web application.The information gathered from Lora-enabled sensors through Lorawan communication gateways and transmitted to the central server via GSM network. Collected IoT telemetry data stored on servers and then visualized using open source software. Up-to date information is available via link: http://dashboard.isoc.kg
Note. Since its scientific project, some publicly available data may have wrong parameters or data due to internal experiments, settings, tuning, etc. Please consult before use in research purposes.